Contents
1.Introduction
2.Overview
2.1 The Geopolitical Background
2.2 Colonization Policy and Facts
2.3 Demographic Pattern of Israeli settlements
2.4 By-pass Roads
3. Statistical Analysis of Israeli Violations
3.1 Violations
3.1.1 Number of Incident
3.1.2 Types of Violations
3.2 Location of Violation
3.2.1 Districts
3.2.2 Villages
4. Satellite Image Analysis
4.1 West Bank
4.2 Gaza Strip
5. Most Recent Colonizing Activities
6. Final Remarks
7.Conclusion
8. Annexes
- 8.1 Appendix A
- 8.2 Appendix B
- 8.3 Appendix C
References
1. Introduction
'Monitoring Israeli Colonization Activities' is a project funded by the Commission of the European Communities during the time span February 2000-February 2002. The project aimed at disseminating information on Israeli colonization by monitoring Israeli colonization activities through the collection of primary and secondary data and by analyzing the data to assess the potential implications of such Israeli colonization activities on the process of the political negotiations between the Palestinian Authority and Israel. Also, the project studied the impact of Israeli colonization activities on surrounding Palestinian communities, land use changes and the environment.
The importance of the project stems from the centrality of Israeli colonization activities in determining the framework of a final solution to the Palestinian-Israeli conflict. As evidenced during Camp David II, the failure of addressing a just solution to the fate of Israeli settlements in the West Bank and Gaza Strip, as well as the failure of finalizing the issues of Jerusalem, borders and Palestinian refugees, culminated in the second Intifada that was erupted in late September 2000. Apparently, colonization activities, as will be shown in this report, have increased in both rate and number, further exacerbating the stalemate and the overall political turmoil in the area.
In this report, the trends of Israeli colonizing activities are demonstrated through various methodologies: statistical and satellite image analyses. The first section of the report will give a geopolitical background to lend context to the sections that follow. The second section deals with statistical data , which will be analyzed by employing graphs and charts to show the trends in Israeli violations and the location of such violations. Finally, the third section provides the satellite image analysis for expansion of Israeli settlements.
2. Overview
2.1 The Geopolitical Background
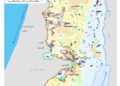
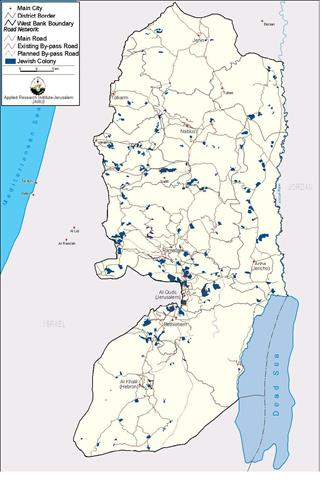
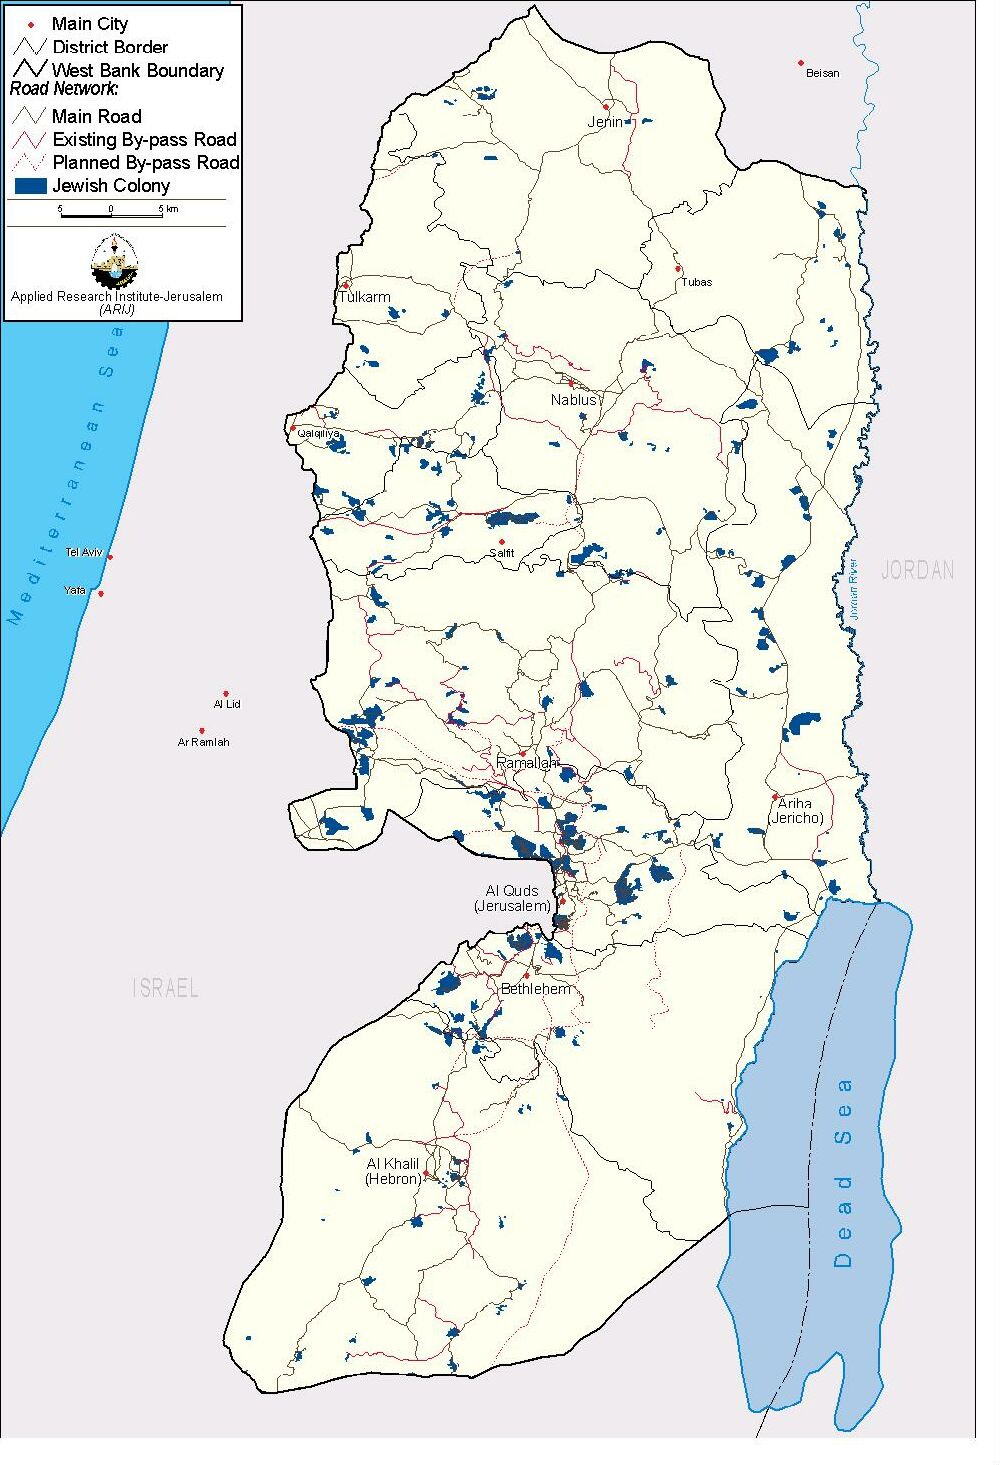
Since the 1967 occupation, Israel has either confiscated or declared as closed areas over 55% of the West Bank and 25% of the Gaza Strip, thereby placing those areas out of Palestinian reach. Palestinians are allowed to use less than 15% of their water resources. Israel has pursued a policy of colonizing Palestine through settlements in an attempt to change its demographic character. Presently, there are 18 Israeli settlements in the Gaza Strip housing an estimated 6,000 Israeli settlers, and over 200 in the West Bank with a population of more than 400,000 settlers; half of whom reside in East Jerusalem. Settlements are distributed all over the West Bank. Figure 1 shows the spatial distribution of Israeli settlements in 2001.
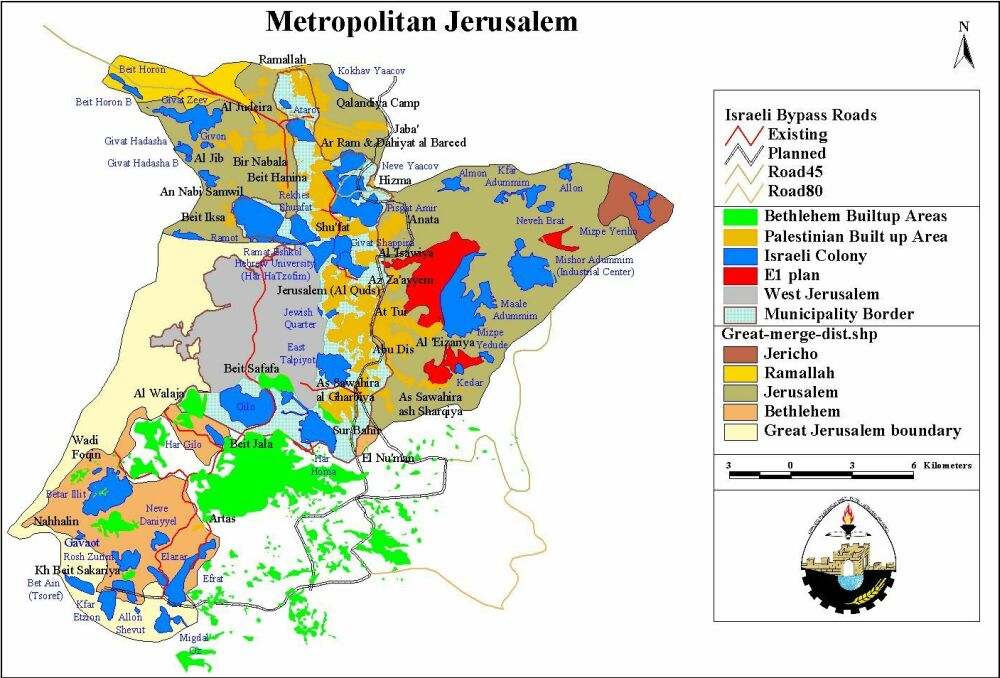
In Jerusalem, Israel expanded the borders of East Jerusalem from 6.5 km�² to 71 km�² to cover areas from Ramallah and Bethlehem districts. Those borders were drawn to include as much vacant land and as little Palestinian built up area as possible; See Figure 2.
Today Israel is in complete control of the city, yet most of the property and real estate still legally belongs to the indigenous Palestinians who have been living continuously in Jerusalem for centuries. Israel's intensive development program after 1967 has involved the construction of housing and associated infrastructure in the unilaterally annexed and expanded territory of occupied East Jerusalem. In addition, in Jerusalem's Old City, the Israeli authorities evicted immediately following the 1967 war an entire neighborhood (Al Maghareba) and levelled it to the ground in order to make way for the Wailing Wall Plaza. Over the years, Israel has been able to take control over 55 location in the old city of Jerusalem.
In 1987, the Intifada broke out carrying its message of rejecting the continuation of occupation and at the same time, calling for a resolution to the historic conflict between Israelis and Palestinians. Consequently, the Palestinian people, by and large, accepted the discourse of peaceful negotiations based on the grounds outlined in the Madrid Conference of 1991. The guiding principles of these negotiations were 'Land for Peace' and the United Nations Resolutions 242 and 338. After several rounds of formal talks in Washington, the PLO and Israel were able to come out with the historic agreement of the Declaration of Principles (DOP), which was signed in September 1993.
The DOP called for an interim period of 5 years during which the representatives of the Palestinian people and the Israeli government will initiate negotiations over the final status, which include Jerusalem, refugees, settlements, borders and water. It was also agreed upon that neither party should initiate any action during the interim period that might jeopardize the outcome of final status negotiations. The 'Oslo II' agreement, signed in Washington D.C. in September of 1995, sets out the interim stage for Palestinian Autonomy in the West Bank and Gaza, pending 'final status negotiations' which were scheduled to begin in May 1996 and finish by May 1999. The Interim Agreement states that the first phase of the Israeli military forces redeployment will be completed prior to the eve of the Palestinian elections, i.e., 22 days before the day of the elections. The further redeployments were to be completed within 18 months from the date of the inauguration of the Council. During this time, the powers and responsibilities relating to territory will be transferred gradually to Palestinian jurisdiction to cover West Bank and Gaza Strip territory, except for the issues that will be negotiated in the permanent status negotiations (i.e. Jerusalem and the Settlements). This meant that 95 % of the West Bank and Gaza should have become under Palestinian control 18 months after the inauguration of the Council.
However, on the ground, this did not happen. Stalling of negotiations and delays as well as renegotiation of what was already agreed upon led to partial Israeli withdrawals so that by the March 2000 the areas under effective Palestinian control amounted to no more than 18.2 %. The following table outlines the various stages of the interim agreements and the changes that occurred to them. Table 1: The Redeployment percentages according to the agreements
|
Agreement |
Date |
Area |
||
|
A |
B |
C |
||
|
Oslo II |
May 1994 |
3 % |
24 % |
73 % |
|
Wye I |
October 1998 |
10.1 % |
18.9 % |
71.0 % |
|
Wye II & III (not implemented) |
18.2 % |
21.8 % |
60.0 % |
|
|
Sharm I |
September 1999 |
10.1 % |
25.9 % |
64.0 % |
|
Sharm II (implemented in delay) |
January 2000 |
12.1 % |
26.9 % |
61.0 % |
|
Sharm III (implemented in delay) |
March 2000 |
18.2 % |
21.8 % |
60.0 % |
|
What should have been |
1997 |
95 % |
0 % |
5 % |
In July 2000, President Clinton hosted the Israeli and Palestinian leaderships for a summit in Camp David in an attempt to revitalize the peace process through an agreement on a final status framework. This was the first real negotiations that tried to address final status issues. The Clinton parameters for a final status agreement related to settlements, borders and Jerusalem included the following:
Territory:
Based on what I heard, I believe that the solution should be in the mid-90 percents, between 94-96 percent of the West Bank territory of the Palestinian State. The land annexed by Israel should be compensated by a land swap of 1-3 percent in addition to territorial arrangements such as a permanent safe passage. The parties also should consider the swap of leased land to meet their respective needs…The Parties should develop a map consistent with the following criteria:
- 80% of settlers in blocks
- contiguity
- Minimize the annexed areas
- Minimize the number of Palestinian affected
Jerusalem:
The general principle is that Arab areas are Palestinian and Jewish ones are Israeli. This would apply to the Old City as well. I urge the two sides to work on maps to create maximum contiguity for both sides.
Regarding the HaramTemple Mount, I believe that the gaps are not related to practical administration but to symbolic issues of sovereignty and to finding a way to accord respect to the religious beliefs of both sides.
I know you have been discussing a number of formulations. I add to these two additional formulations guaranteeing Palestinian effective control over the Haram while respecting the conviction of the Jewish People. Regarding either one of those two formulations will be international monitoring to provide mutual confidence.
1. Palestinian sovereignty over the Haram and Israeli sovereignty over a) the Western Wall and the space sacred to Judaism of which it is a part or b) the Western Wall and the Holy of Holies of which it is a part.
There will be a firm commitment by both not to excavate beneath the Haram or behind the Wall.
2. Palestinian sovereignty over the Haram and Israeli sovereignty over the Western Wall and shared functional sovereignty over the issue of excavation under the Haram and behind the Wall such that mutual consent would be requested before any excavation can take place.
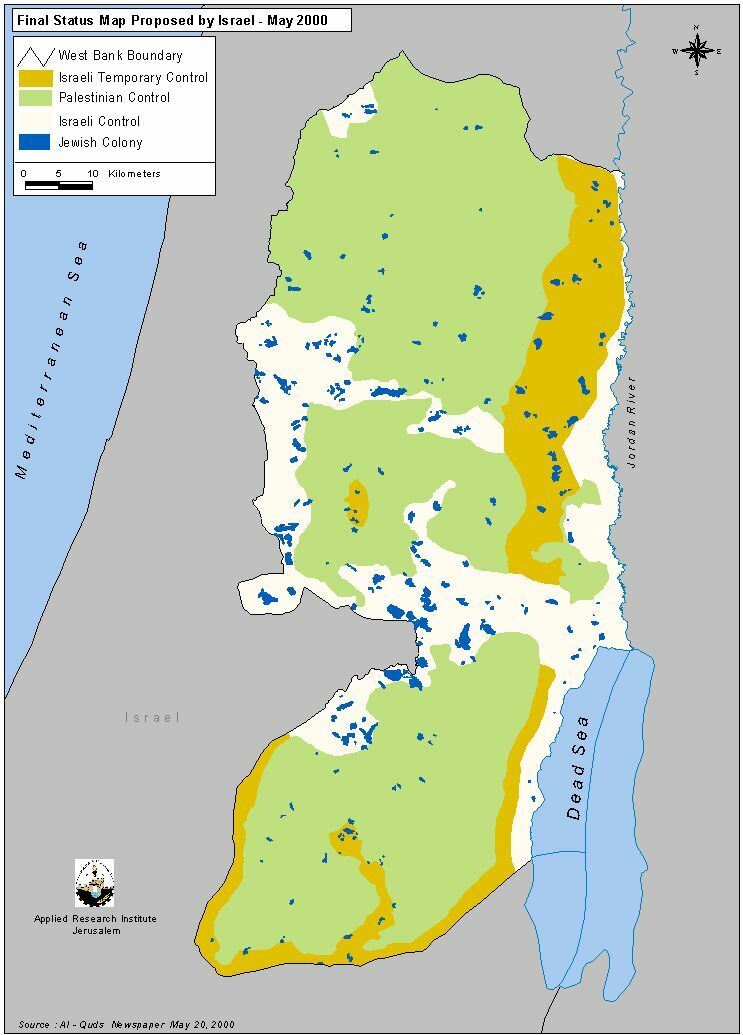
Figure 3: shows a map that was given to the Palestinians during Camp David summit.
Palestinians could not accept such a proposal which totally negates UN resolutions 242 and 338 as well as the right of return and carves the West Bank to accommodate Jewish settlements and perpetuates Israeli control on large areas in East Jerusalem. On 28 September, 2000, al Aqsa Intifada erupted following the provocative entry of Mr. Ariel Sharon to the sacred vicinity of Al Aqsa. The closure imposed by Israel on the Palestinian Territories since the beginning of the Aqsa Intifada has restricted the ability of Palestinians to travel and work to a degree unprecedented in the 34-year Israeli occupation of the West Bank and Gaza Strip. The internal closure separates Palestinian localities from each other and results in the hampering or complete freezing of the economic, political, educational, medical, and social service activities necessary for a healthy society. Such a cantonization of the Palestinian Territories is achieved through the use of roadblocks (including destroying the roads themselves), checkpoints, and military patrols, all built upon the skeleton of the Jewish settlements.
In an attempt to rescue the peace process, president Arafat launched an initiative to resume negotiations. In January , 2001, Israeli and Palestinian negotiators held marathon negotiations in Taba. By then, Israeli elections were close and thus, the Israeli leadership could not take the necessary decisions. The Israeli side repackaged their old positions which do not meet Palestinian aspirations. The Israeli side blamed the Palestinians for not accepting their 'generous' offer and played the percentage game claiming they offered the Palestinians more than 97 % of the West Bank. The fact is that Israel insisted on retaining the large settlement blocks of Modi'in , Gush Etzion, Ariel and Jerusalem which account for more than 12 % of the West Bank. The Taba negotiations failed and Israel continued its unilateral actions.
By overlaying maps of the checkpoints and roadblocks in the West Bank with a map of Areas A and B, a composite map was developed that interprets how the Israeli army has carried out its plan to divide the West Bank into 64 isolated areas and where those areas lie.
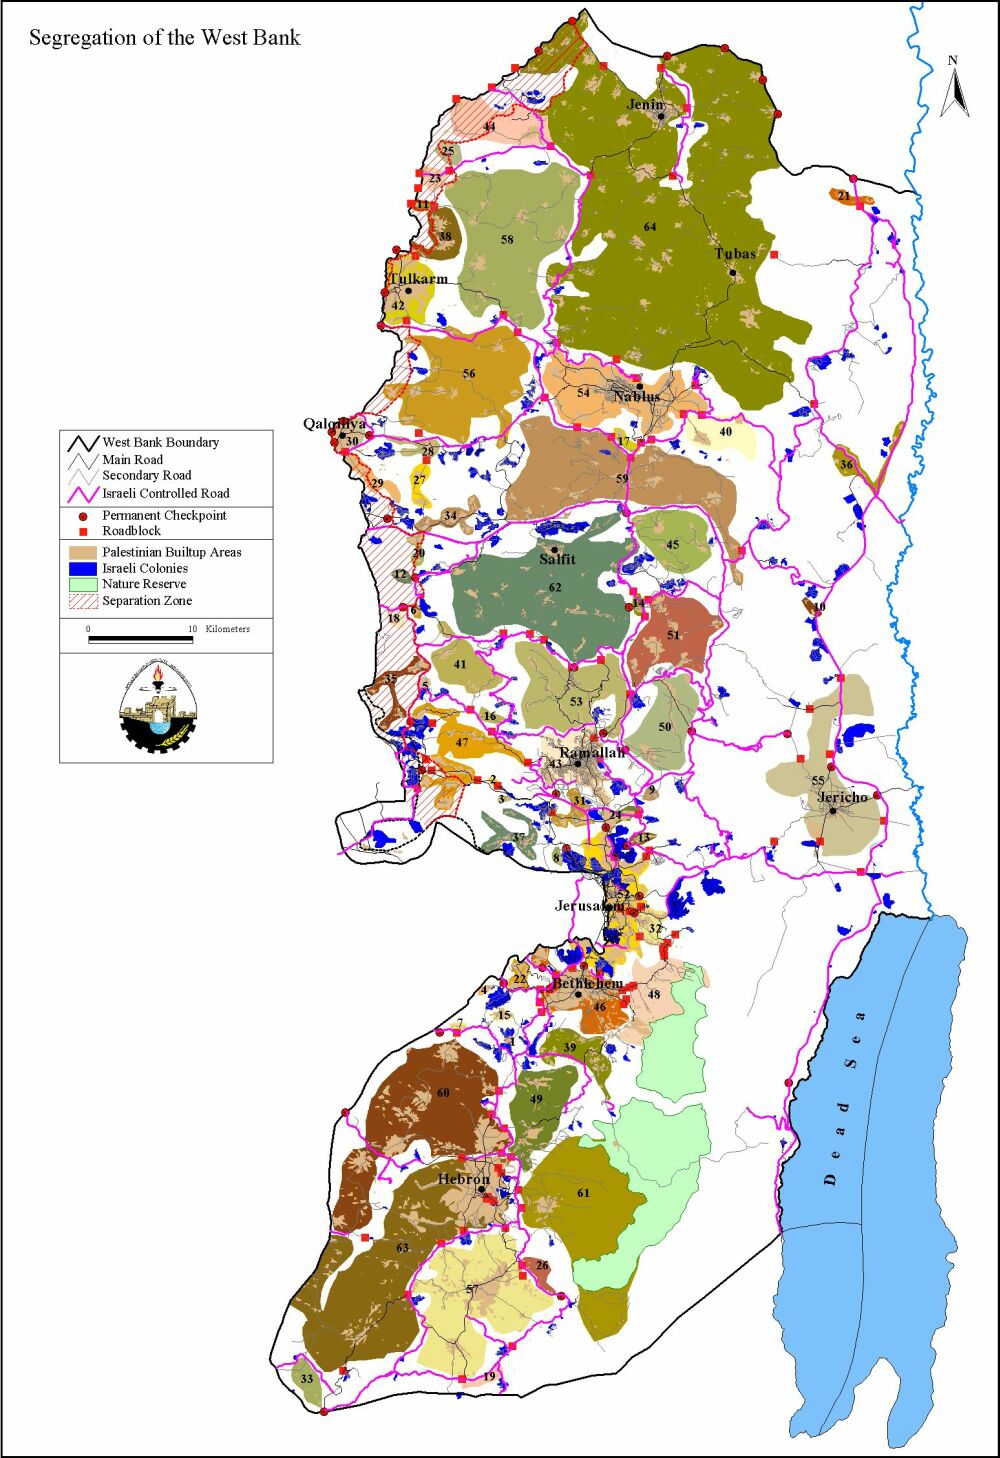
Figure 4: Segregation map
Beyond the immediate impact of this internal closure on Palestinian life in all West Bank districts, the areas in which the Israeli authorities have isolated Palestinians has far-reaching political implications. In an interview with Ariel Sharon by a Ha'aretz correspondent on April 12, 2001 the Prime Minister declared that he would relinquish only 42% of the West Bank for a future Palestinian state. He also declared a complete unwillingness to evacuate any Jewish settlements, the centerpiece of Israeli claims to the land. Says Sharon: 'It's not by accident that the settlements are located where they are. They safeguard the cradle of the Jewish people's birth and also provide strategic depth which is vital to our existence. The settlements were established according to the conception that, come what may, we have to hold the western security area, which is adjacent to the Green Line, and the eastern security area along the Jordan River and the roads linking the two. And Jerusalem, of course. And the hill aquifer.'
The cumulative area of the 64 cantons in Figure 4 constitutes about 40% of the total West Bank area. If Sharon has his way, this area will correspond closely with that of any Palestinian 'state' recognized by Israel in the indefinite future. Such an arrangement would, in fact, eliminate the possibility of a viable state and leave the Palestinians in permanent subjectivity to Israel. The resulting Palestinian enclaves would be completely surrounded by Israel and movement from and between these areas dependent upon Israeli approval. Furthermore, what Sharon calls the western and eastern security areas, along with the hill aquifer, are the most fertile parts of the West Bank and the richest sources of water. This would leave the Palestinians with no basis for economic development..
During the period of July-September 2001, Sharon's government launched its new-old policy of unilateral segregation between the West Bank and the Israeli-controlled territories. Military orders were issued to seize a total of 224,000 Dunums from the northern districts, especially Jenin, Ramallah, Qalqilyia and Tulkarem. According to these military orders, isolated sectors along the 1949 Armistice Line (Green Line) were rendered closed military areas; i.e. no one was allowed to enter these areas without having a special permit issued by the Israeli authorities( click for more details ); See Figure 5.
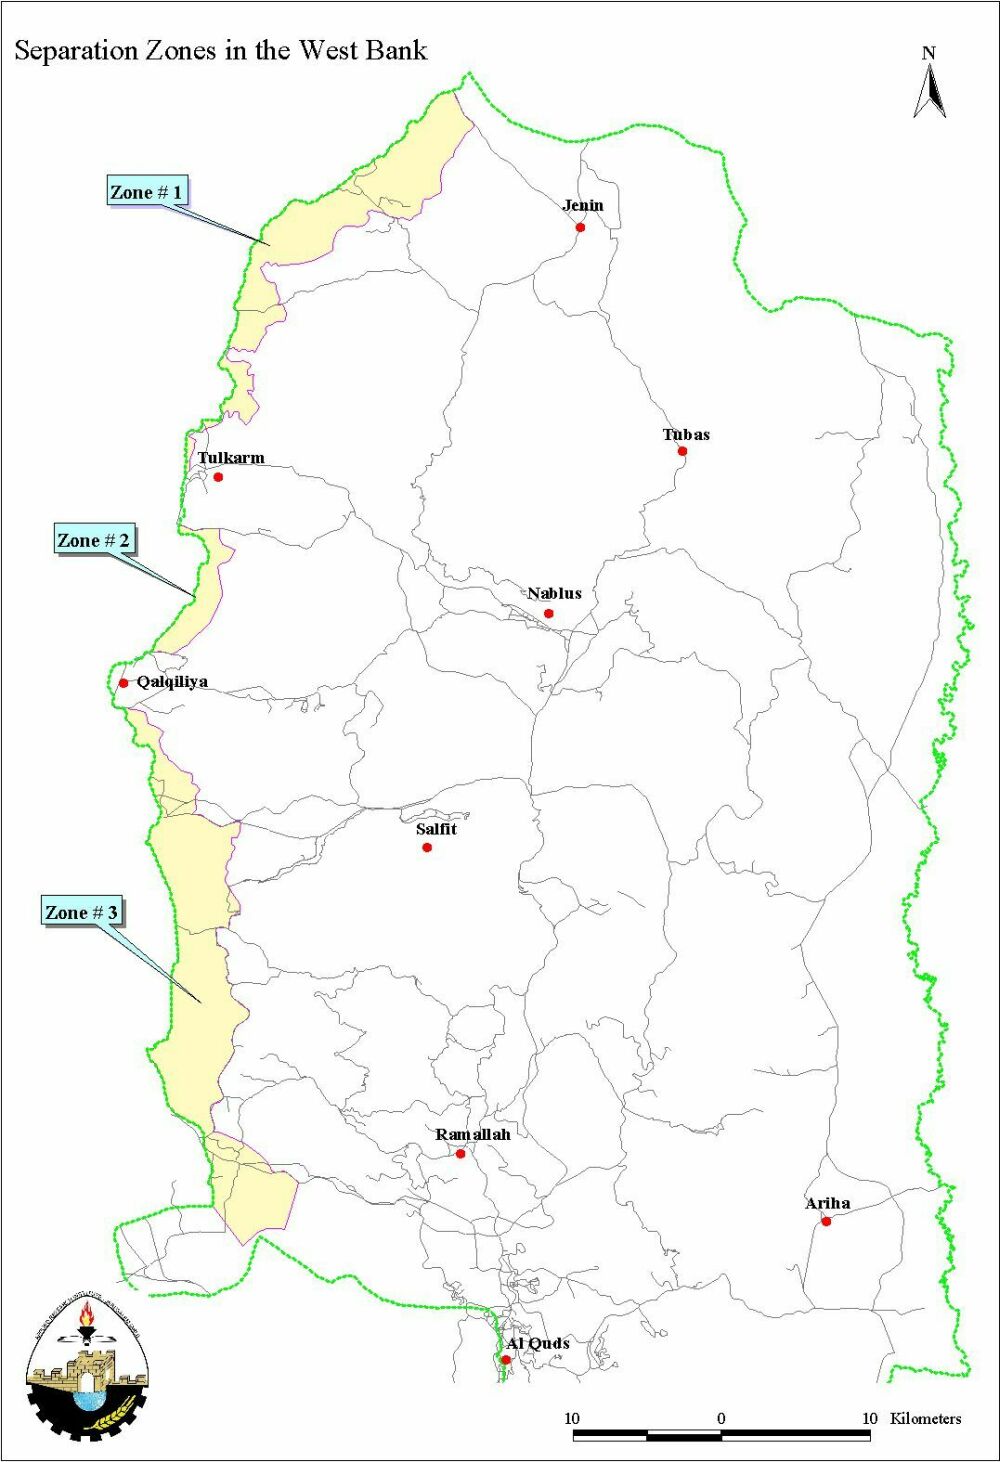
Sharon's plan was more intensively implemented during the latest massive invasion in the West Bank, where most of the annexation of land to create military zones, concentrated around the Jerusalem boundaries.; thus, expanding the illegal boundaries of Jerusalem.
Furthermore, on May 15th 2002, Israel announced a policy of dividing the West Bank into 8 besieged areas, where Palestinians will be forced to obtain special permits from the Israeli authorities to be able to move between these areas.
2.2 Colonization Policy and Facts :
As discussed above, since the signing of the Declaration of Principles in 1993, Israel has followed a policy of creating de facto realities on the ground to affect the outcome of the final status negotiations. Israel has accelerated its colonizing activities by confiscating more Palestinian land to establish new settlements on hilltops and build a comprehensive network of by-pass roads. These activities have been a main source of the instability in the peace negotiations between the government of Israel and the Palestinians.
According to Israeli data there are 140 settlements in the West Bank and Gaza, however satellite images show 282 Jewish built-up areas in the West Bank including East Jerusalem and 26 in Gaza. This is excluding military sites. These built-up areas cover 181.3 sq. km (GIS database, ARIJ, 2001). The discrepancy stems from the fact that Israeli sources consider those Jewish built-up areas in East Jerusalem as neighborhoods of the Israeli-defined Jerusalem municipality and not as settlements. Israel does not identify the new expansions of settlements as separate sites; however, in our sources these new expansions are treated as a new individual settlement by itself, for example, Talamon was expanded to various areas that are distant from the original settlement, according to Israeli sources, these sites are lumped in to one settlement i.e. Talamon, however, we refer to some of these areas as Talamon B and Talamon C. In another example, the settlement of Itamar in Nablus is divided into Itamar east 1, Itamar east 2, Itamar east 3 etc. This explains the discrepancy in the figures. Currently the total number of settlers in the West Bank and the Gaza Strip number around 400,000 of which nearly 200,000 are in East Jerusalem alone.
Table 2: Land Use in the West Bank
|
|
Area in km�² |
Percent of the West Bank |
|
Palestinian built-up areas in the West Bank |
367.7 |
6.4 % |
|
Jewish settlements in the West Bank |
154.7 |
2.7 % |
|
Israeli Military Base |
37.9 |
0.6 % |
|
Closed Military Area + newly closed area |
1223.1 |
21.6 % |
* West Bank area including East Jerusalem is 5661 Km2
Source: ARIJ database
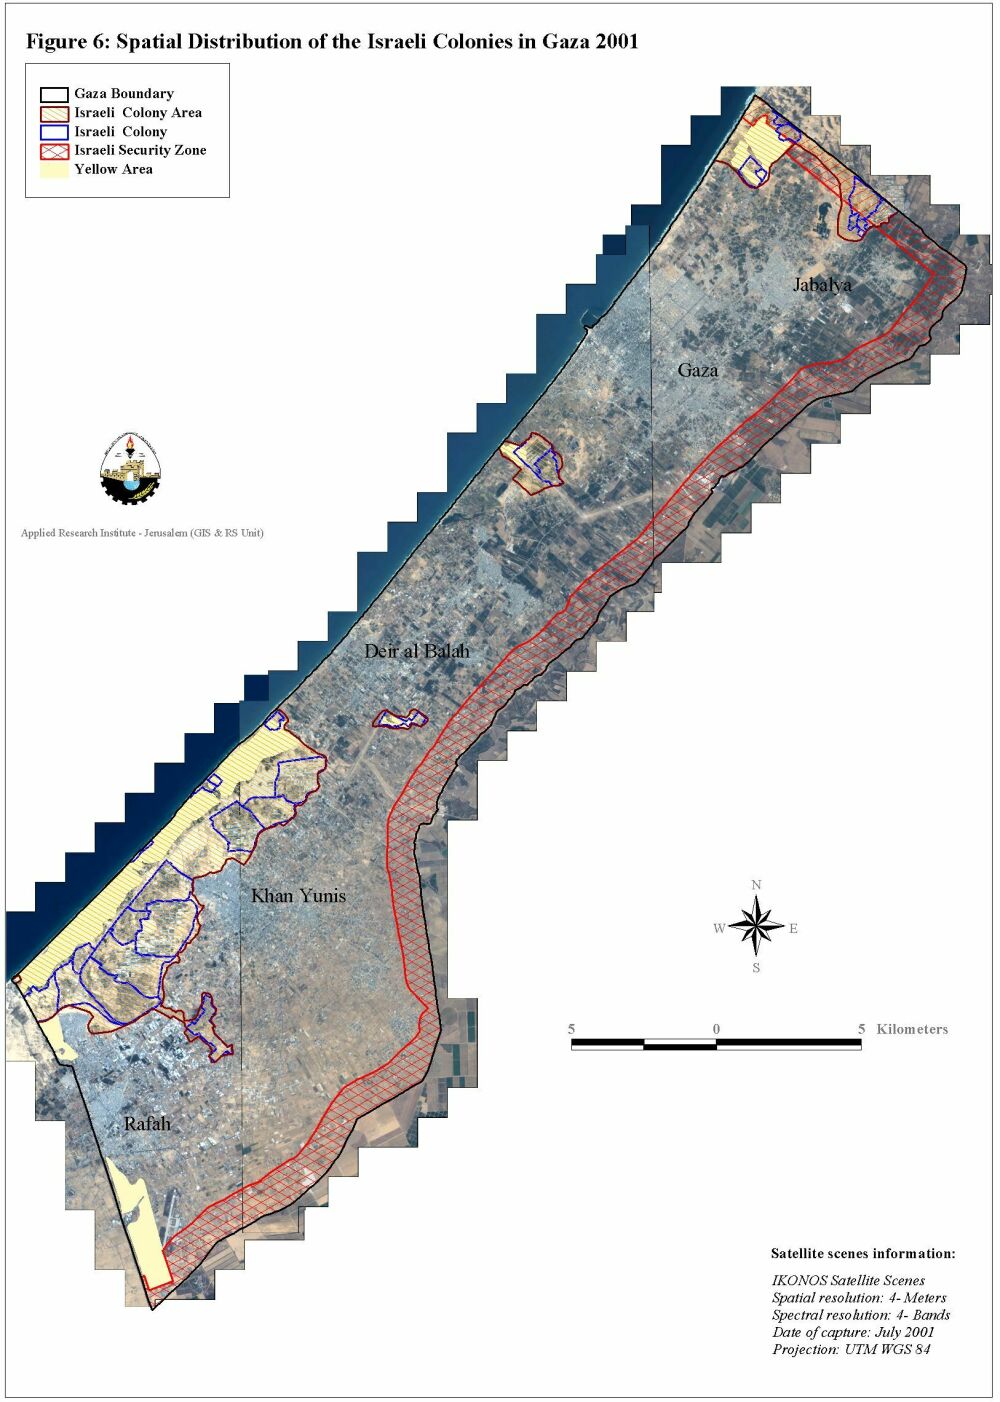
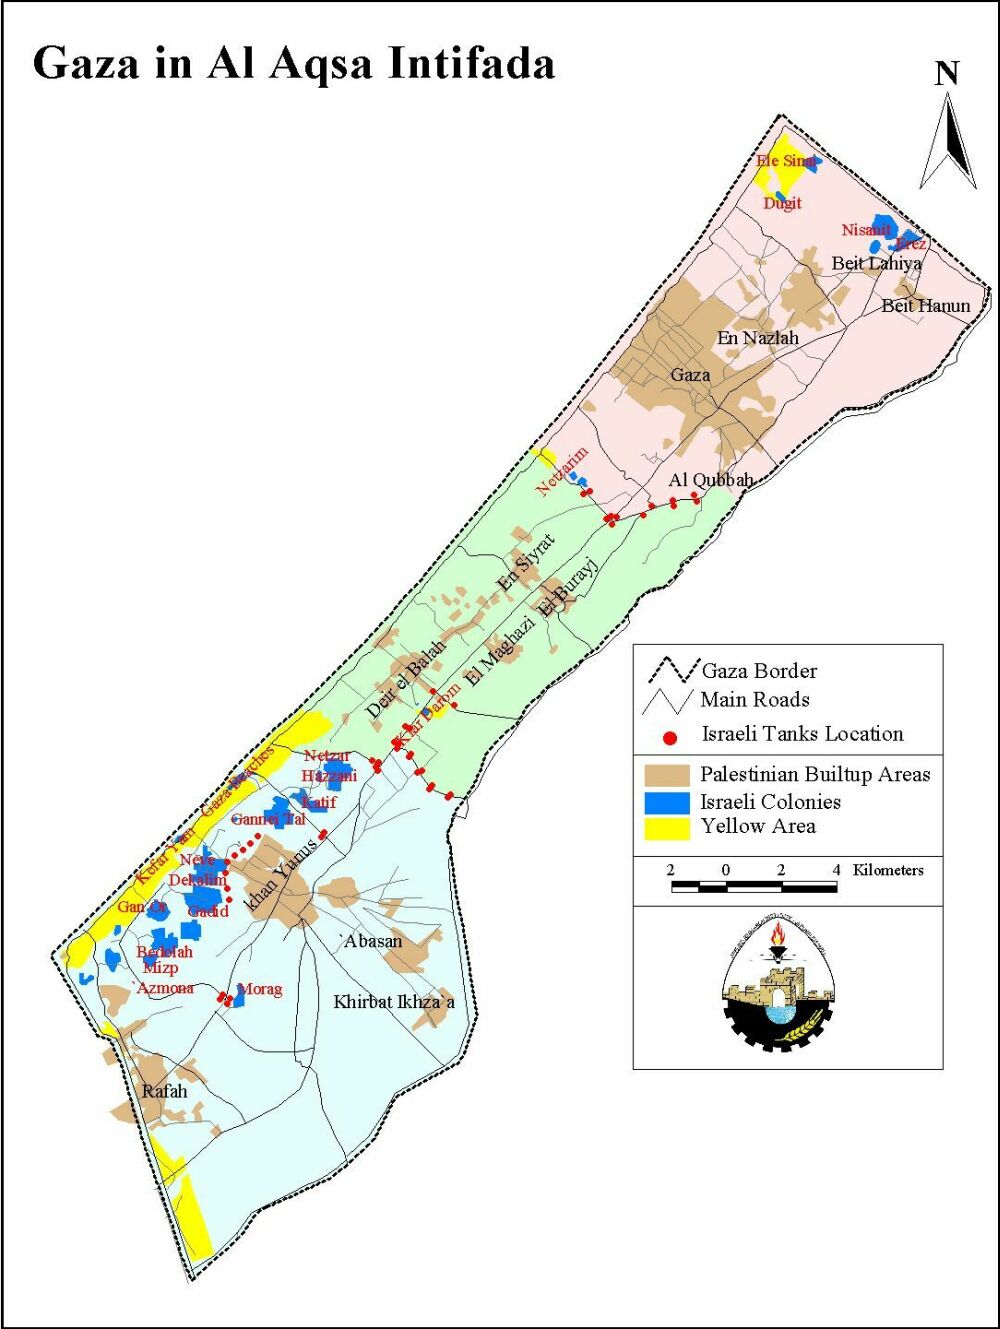
The preceding table shows how Israel managed, in 30 years of occupation, to confiscate and expropriate over 30% of the West Bank for exclusive Jewish use. In Gaza Strip, the total Israeli settlement area covers 53.8 km2 (14.8%) of the Gaza Strip, whereby 6,000 settlers live. See Figure 6
Jewish settlements are scattered all over the West Bank and lie predominantly to the south along the coast in the Gaza Strip. Successive Israeli governments have encouraged the development of specific blocks more than others. In the West Bank, the focus has been on the following areas:
- The Jerusalem area to create demographic barricades in front of any Palestinian claims to it,
- Along the West Bank's western edges so as to make the return to the 1967 borders practically impossible, and so as to make the settlements appealing to settlers, who commute to work inside Israel
- The Jordan valley for its presumed importance to Israel's security as well as for its agricultural resources.
Furthermore, the growth of settlements is mainly geared to the formation of blocks; i.e. they grow outwards and towards each other. The end result of such a growth is the grouping of Palestinian towns and villages into three or four cantons. Indeed, the Israeli intention is to make the contiguity of any Palestinian State in the future practically unattainable.
The Labor and Likud Israeli governments have maintained progressive expansions of these settlements. To achieve this goal, they have confiscated Palestinian land, demolished their houses, and uprooted thousands of trees. Since the signing of the Declaration of Principles in 1993 and until February 2002, more than 243,373 Dunums of land have been confiscated, 224,329trees have been uprooted and over 718 houses demolished in the West Bank alone. At the Applied Research Institute-Jerusalem (ARIJ), the change in the size of West Bank settlements is monitored by satellite. Table 3: The growth of settlement Area in the West Bank
|
Year |
Settlement Area (sq. km) |
Percent of the West Bank |
|
1997 |
108.9 |
1.92% |
|
1999 |
147.8 |
2.61% |
|
2000 |
150.5 |
2.66% |
|
2001 |
154.4 |
2.73% |
Source: ARIJ Database 2001
Prime Minister Sharon's administration has declared that they will not shy away from building in settlements in order to accommodate their 'natural' population growth. But table 4 below shows clearly that the growth of the settler population is far from natural. The tax breaks and cheap housing serve as good material incentives, in addition to the ideological drive means huge numbers of Israelis are moving into the occupied territories each year. It seems likely that this is the growth that the Sharon government will build to accommodate.
2.3Demographic Pattern of Israeli Settlements
The growth in settlements varied from one district to the other. Between 1992 and 2001 there was a remarkable increase in the settler population in Ramallah district (298% relative increase). This indicates that, after having focused on Jerusalem for many years (as noted before, there are as many settlers in Jerusalem as there are in the rest of the West Bank), the Israelis started enlarging the settlements in the adjacent districts especially Ramallah. It is worth mentioning here that the PNA's official districts was used in the following table to classify settlements' population growth, See Figure 7

Table 4: Absolute and Relative Growth in settlements 1996 – 2001, by District
|
District |
Settlers 1992 |
Settlers 1996 |
Settlers 2001 (estimated) |
Absolute Growth (2001-1992) |
Relative Growth (1992-2001) |
|
Bethlehem |
40430 |
48312 |
63248 |
14936 |
37% |
|
Gaza |
3775 |
5266 |
7288 |
2022 |
54% |
|
Hebron |
9375 |
11578 |
14296 |
2718 |
29% |
|
Jenin |
1125 |
1421 |
1875 |
454 |
40% |
|
Jericho |
3965 |
4285 |
4929 |
644 |
16% |
|
Jerusalem |
136170 |
162887 |
195659 |
32772 |
24% |
|
Nablus |
4195 |
5441 |
8687 |
3246 |
77% |
|
Qalqilyia |
19250 |
22064 |
27940 |
5876 |
31% |
|
Ramallah |
11660 |
23121 |
54424 |
31303 |
268% |
|
Salfit |
16555 |
20420 |
25517 |
5097 |
31% |
|
Tubas |
725 |
852 |
1091 |
239 |
33% |
|
Tulkarem |
775 |
1272 |
2394 |
1122 |
145% . |
Source: ARIJ database 2002
It is worth noting that there is a discrepancy between the average growth rate fore Jews in Israel and that in Jewish settlements. The average growth rate for Jews in Israel is 2.0% per year (the rate including non-Jews is 2.5% per year). However, the population of the Jewish settlements grows at around 8.5% per year, which amounts to over four times the Israeli growth rate. Between 1996-98 there were 130 settlements that had an average annual growth of over 2%. That means that over 80% of the settlements grow at rates higher than the overall Israeli average( click for more details ) .
According to the Israeli Interior Ministry the settlers population in the West Bank excluding Jerusalem, grew by 8% last year (Average annual growth rate within the State of Israel is less than 2.5%, Israeli Abstract yearbook, 1999). Certain settlements continue to show huge growth rates, notably Betar Illit (24.6%) and Kiryat Sefer (28.1%). The following graph shows a comparison of growth rates.
2.4 Bypass Roads
The term bypass roads came with the advent of the Oslo Accords and were not present before that. These roads are used by the Israelis to link settlements with each other and with Israel. In the agreements they are called 'Lateral Roads' but people usually call them 'bypass' roads because they are meant to circumvent (i.e. bypass) Palestinian built up areas. These roads are of course under Israeli control and entail a 50 to 75 meter buffer zone on each side of the road in which no construction is allowed.
The construction of by-pass roads commonly occurs along the perimeter of Palestinian built-up areas. As a result, these roads carve up the Palestinian areas into isolated ghettos and often deprive Palestinians of vital agricultural land. These practices have fragmented both land and people. This situation is very serious within the major cities of the West Bank where by-pass roads form asphalt boundaries that limit the expansion and development of the Palestinian communities, and further disconnect Palestinian communities from each other. Figure 8 marks those roads built by the Israelis since the Oslo Accords.
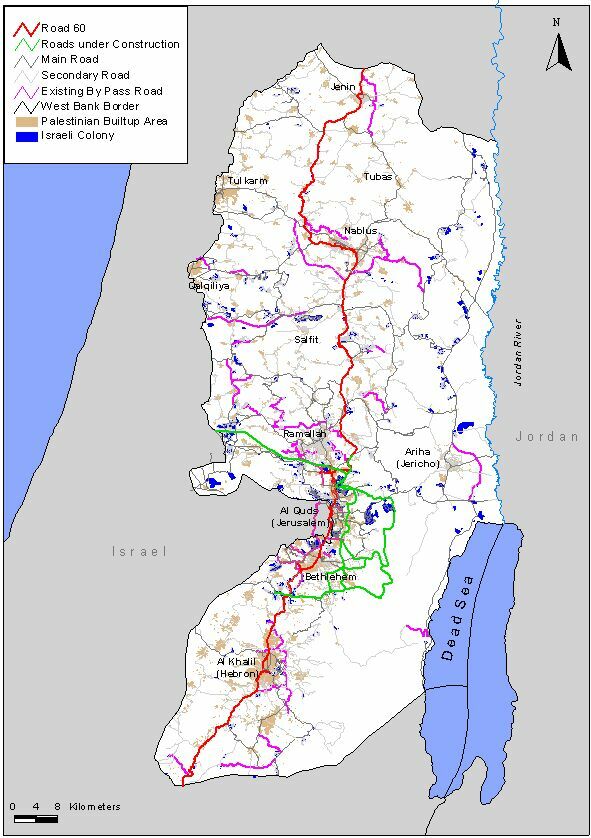
The construction of these by-pass roads requires the confiscation and destruction of approximately 87 km�² of Palestinian land, most of which is agricultural. These bypass roads were constructed through a grant from the USA government in order to 'help' Israel in complying with the signed agreements and avoid friction between Jewish settlers and Palestinians. The role of the bypass roads became evident during the Intifada where they became the scissors that cut the Palestinian areas into 64 homelands in the West Bank and 3 homelands in Gaza. See Figure 9
3. Statistical Analysis of Israeli Violations
The data that appear in the monthly, quarterly and comprehensive reports are collected from Palestinian and Israeli newspapers, satellite images, aerial photos, fieldworkers' reports, ARIJ and LRC verification and reports from other organizations. The reports that are received are divided up according to the agreed classifications. These classifications and their definitions are as follows:
|
C = Construction; any increase in Israeli built-up areas |
|
D = Demolition; any destruction of Palestinian assets |
|
E = Expansion; any increase in land occupied by Israelis |
|
P = Plans; plans issued for acts in any other category, or attempts at violations such as attempts at seizure. |
|
R = Roads; any increase in the road network or changes in road blocks |
|
S = Seizure; confiscation, eviction, occupation and any sort of asset grabbing |
|
U = Uprooting trees |
It is worth noting that the two years covered in this report witnessed an upsurge of Israeli violence in the Palestinian Territories; such violence included massive shelling, closure and reoccupation of various parts of the Palestinian areas. However, this report does not deal with data on such Israeli violations; therefore, demolition activities as compiled in this report do not cover data on the houses or infrastructure destroyed from shelling.
Incidents are categorized as to the district they occurred in. During the period of this project (2000-2002), the districts used are eight in the West Bank (Nablus, Jericho, Jenin, Jerusalem, Ramallah, Hebron, Bethlehem and Tulkarm) and the Gaza Strip. From February 2001, the PNA's districts were officially demarcated (these include in addition to those mentioned: Salfit, Tubas and Qalqilyia) as their borders had not yet been confirmed. However, this comprehensive report continues to use the old classification of districts, so as to keep consistent with the data compilation of the first comprehensive report; this allows better comparison in the trends of Israeli colonization activities in each location of the Palestinian Territories.
3.1 Violations
3.1.1 Number of Incidents
A total of 1224 colonizing incidents were recorded between February 2000 and February 2001, 841 in the West Bank and 383 in Gaza Strip. The rate at which incidents occurred varied considerably, where the overall political climate directly influences the trend. All in all, since the Al-Aqsa Intifada started in 29 September 2000, there has been a considerable increase in the number of incidents in the Occupied Territories. This rise can be seen from the average number of violations per month. Last year the average was 36 incidents per month, while this year it doubled to 67.
Chart 1: Number of incidents per month for the period February 2000 till February 2002.
3.1.2 Types of Violations
In the West Bank, the largest category of incident this year has been 'Uprooting trees'. The Intifada has seen a particular upsurge in this incident with the army becoming renowned for uprooting large areas of land (particularly olive trees) under the pretext of security. Charts 2 and 3 show how the incidents are divided between the categories in the West Bank and Gaza Strip. Although the absolute number of tree uprooting incidences is lower in Gaza than in the West Bank, when one considers the relative sizes of the two areas it can be seen that the tree damage in Gaza has been more intense.
Chart 2
Chart 3
Uprooting trees and demolition incidents increased rapidly since the beginning of Al-Aqsa Intifada in both the West Bank and Gaza. In Gaza, it is noted that both uprooting and demolition activities simultaneously peaked in the first few months of the Intifada. Uprooting and demolition incidents have been particularly significant because of Israel's plan to create buffering zones alongside by-pass roads, under the pretext of security. It is worth mentioning that most of the uprooted trees were olive trees. During the picking season in autumn, it can be noted that uprooting incidents accelerate causing detrimental economic losses for many Palestinian farmers.
Chart 4
Chart 5
Chart 6 below gives an estimate of the numbers of trees uprooted and destroyed over the past two years in the West Bank. The huge surge in this type of destruction can be seen clearly since the start of the Intifada. However, 81.4 % of the trees that were uprooted during the last two years were damaged between March and February 2002, i.e. during Sharon's premiership.
Chart 6
Through field studies, and using GPS positioning, ARIJ has mapped the location of Palestinian houses demolished, or slated for demolition, by the Israeli government. The locations of these acts of destruction repeatedly occur along both planned and existing by-pass roads, and at the outskirts of Palestinian communities. This serves to limit the growth and movement of Palestinians, and further the Israeli commitment to creating 'facts on the ground.'
The advent of the coalition government with Sharon as its head meant that a more aggressive policy of house demolitions was going to be enacted. Chart 7 shows, house demolitions increased considerably after the Sharon came to power.
Chart 7
Moreover, seizure and expansion incidents increased considerably during Al-Aqsa Intifada. The total numbers of seizure and expansion incidents are higher in the West Bank reaching 180 and 129 incidents respectively, whereas in Gaza they reached 42 and 17 incidents respectively.
Chart 8
3.2 Location of Violations
3.2.1 Districts
As mentioned in the introduction, the incident events in the West Bank are categorized according to the district in which they occur. Eight district divisions were used. By counting the number of incidents occurring in each district we can locate which areas suffered most from these kinds of incidents; See Figure 10, Figure 11, Figure 12, Figure 13.
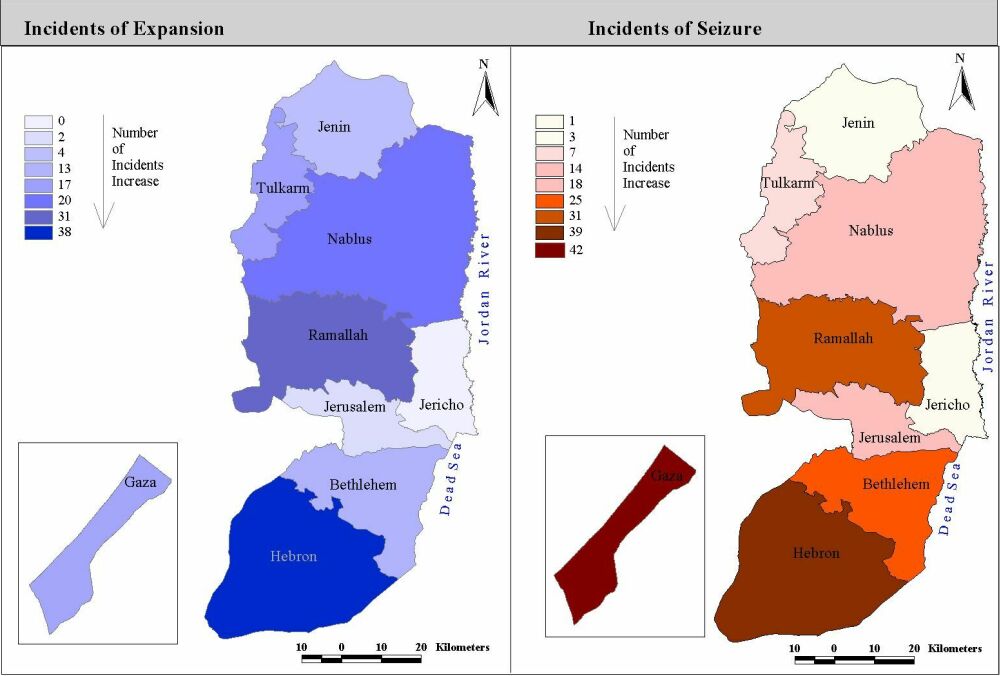
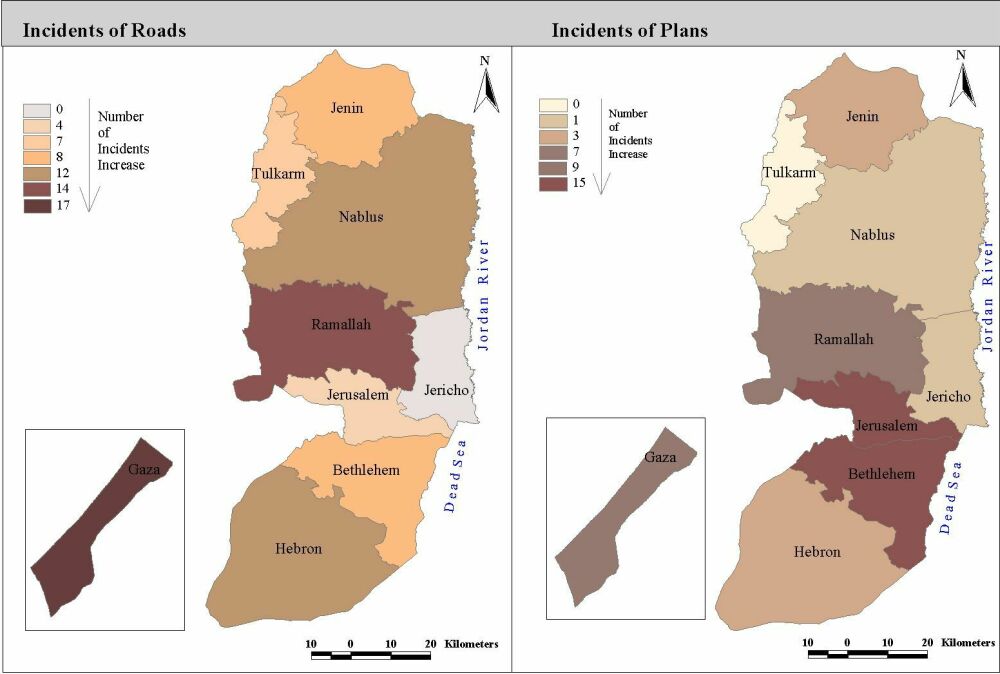
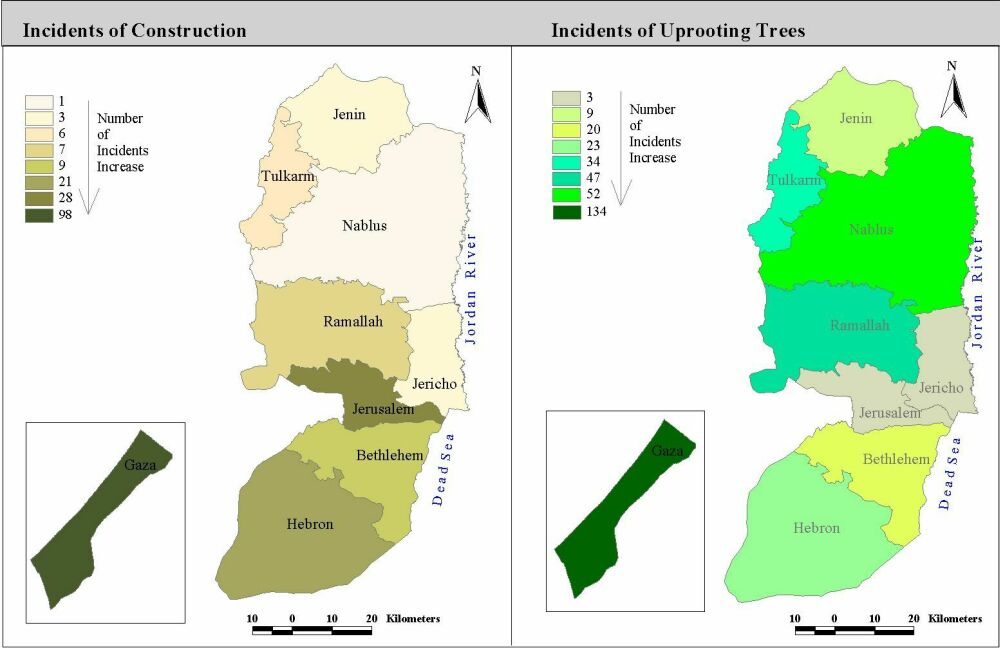

Chart 10 shows the percentage of the total number of incidents in each district in the West Bank. This includes incidents by both settlers and the Israeli authorities. Hebron experienced the largest number of incidents at 172. Ramallah, Nablus and Bethlehem were the next worst affected with 154, 140 and 123 incidents respectively. In the same time, the overall incidents in Gaza strip districts are 383.
Chart 10
More detail is provided by the break down of incidents into violations in each district. Nearly 46% of all tree uprooting in the West Bank occurred in Nablus (25%) and Ramallah (21%).
Chart 11
Jerusalem was notably affected by demolition incidents as shown in Chart 12. Such a high rate of demolition incidents (35%) is due to the fact that Jerusalem is still largely under Israeli control, where Jerusalem residents are subjected to discriminatory policies, particularly in their rights of residence and construction. Such policies fall under a larger Israeli occupation plan to restrain Palestinian demographic growth in Jerusalem.
Chart 12
3.2.2 Villages
Certain villages, like certain districts are more severely affected by Israeli violations than others; See Figure 14.
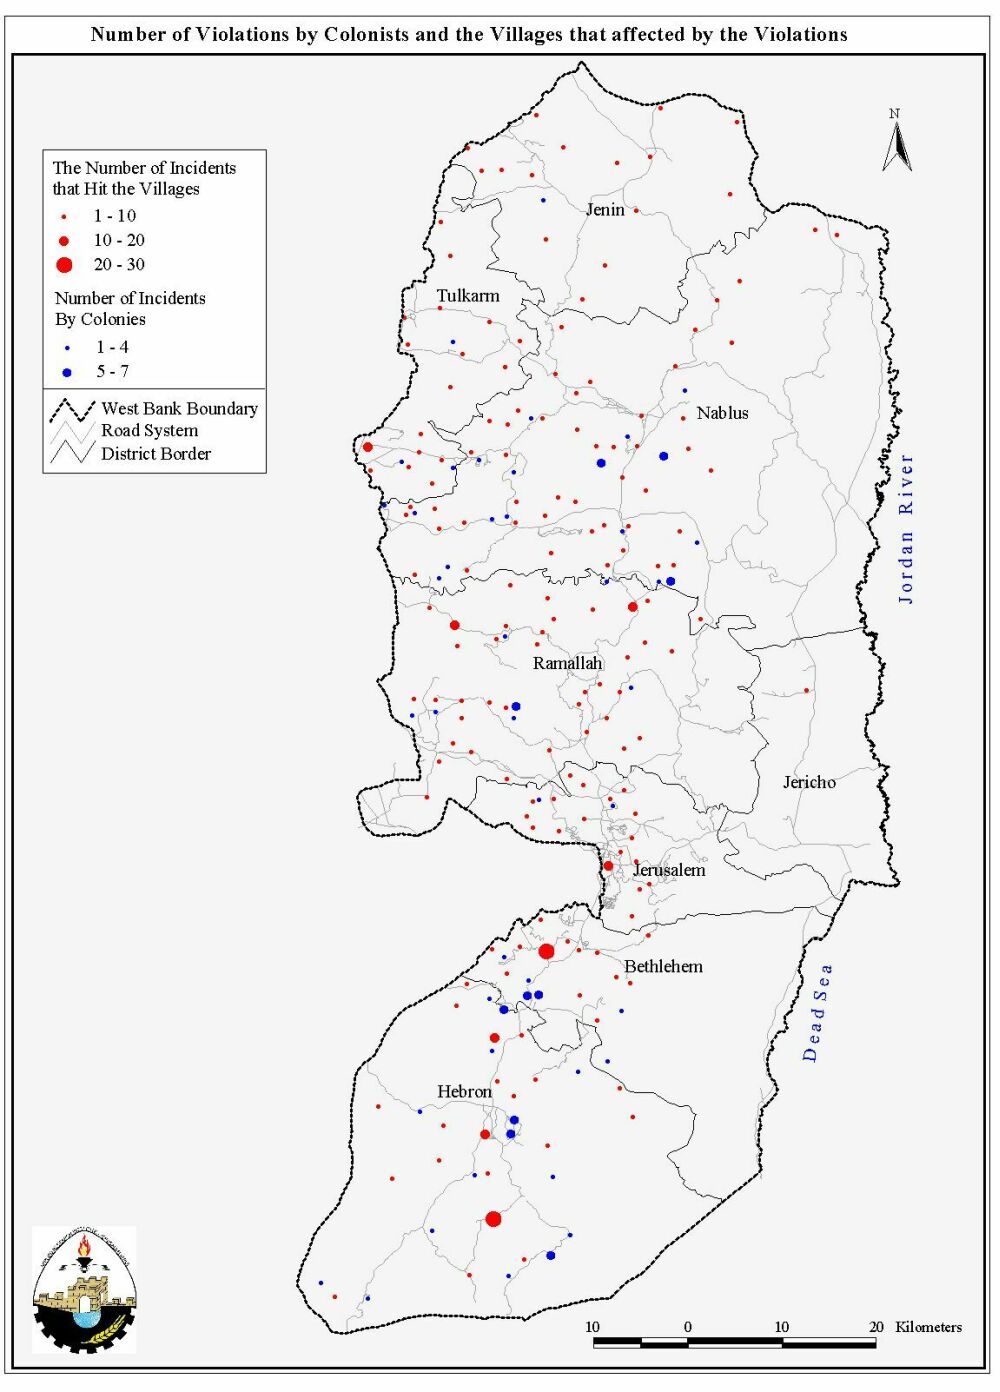
In Bethlehem District, 36 of the total 107 incidents (34%) affected Al-Khader village. According to the 1997 Palestinian census*, this village has about 5% of the population of Bethlehem district. This small portion of the population suffers far more than the other 95% of the district. Moreover, 36% of total incidents in Bethlehem district occurred in Nahalin, Husan, Tuqu', Beit Jala, Ta'amreh and Za'tara.
-
In Hebron District, 30 of the total 136 incidents (22%) affected Yatta village. 29% impacted Hebron city, Beit Ummar and Halhoul .
-
In Jenin District, 45% of the total 42 incidents occurred in Ya'bed, Jenin city, Barta'a village and Tamoun.
-
In Nablus District, 17% of the total 154 incidents occurred in Mas-ha, Jalud, Kafr Al-Deik and Qariot.
-
In Ramallah District, 21% of the total 170 incidents occurred in Sinjil, Aboud and Ras-Karkar villages.
-
In Tulkarem, 22% of the total 122 incidents occurred in Qalqylia city, Isla and Shoufa villages.
-
In Jerusalem, 27% of the total 139 incidents occurred inside the old city . 25% impacted Sheikh Jarrah, Beit Hanina, Jabal Al-Mukaber and Essawiyeh.
-
In Jericho, 62% of total incidents occurred in Al 'Auja village.
*Israeli Central Bureau of Statistics
Chart 13
Chart 14
Charts 13 and 14 can be used to calculate the activity of the settlers in each district, by dividing the percentages in Chart 13 by those in Chart 14. The ratio of the percentage of incidents in a district to the percentage of settlers in a district allows us to compare the number of settler violations relative to the population size. This number indicates which settlers are more aggressive relative to others.
Chart15
The higher the ratio shown in Chart 15, the greater the number of violations per settler is. It is clear that the settlers in Hebron and Gaza are by far the most disproportionate violators. Settlers in Nablus, Ramallah and Tulkarm are the next most active violators.
It is shown in Chart 15 that settlers in some districts are worse than settlers in other districts. By examining the raw data, one can also single out which particular settlements have the worst records for violations. In the West Bank, 12 settlements have each been responsible for five or more incidents, where Yizhar settlement (in Nablus district), Gush Etzion settlement (in Bethlehem district), Efrat settlement (in Bethlehem district) and Talmon settlement (in Ramallah district) having by far the worst record, with 7 incidents each.; see Chart 13. The settlers of Ma'on (in Hebron district) were responsible for six incidents. Efrat and Gush Etzion (Bethlehem), Yizhar (Nablus) and Talmon (Ramallah) settlements were each responsible for seven incidents.
4. Satellite Image Analysis
Another method of analysis in this report is to monitor and evaluate Israeli settlement expansions using satellite data. For this purpose, a high resolution satellite images (IKONOS) along with data gathered on the ground were used to visually pinpoint different stages of colonizing activities. The Geographical Information System (GIS) unit has tracked the rate of expansion of Israeli settlements in the districts of the West Bank in five different years, 1990,1996,2000 and 2001. The expansion of Israeli settlements during the time span of the project (Feb.2000-Feb.2002), has been also tracked in details .
4.1 West Bank
Table 5 shows the settlements that were mostly expanded in each district of the West Bank from August 1999-April2001.
Table5: Mostly expanded settlements in the Districts of the West Bank :
|
District |
Settlement |
Expansion Area in Dunums |
|
Bethlehem |
Neve Danyyel |
280 |
|
Hebron |
Maale Amos |
134 |
|
Jenin |
Shaked |
118 |
|
Jericho |
Noomi |
81 |
|
Jerusalem |
Adam (Geva Benyamin) |
111 |
|
Nablus |
Shavei Shomron (south) |
254 |
|
Qalqiliya |
Alfei Menashe |
369 |
|
Ramallah |
Dolev |
553 |
|
Salfit |
Elkana |
238 |
|
Tubas |
Beqaot |
169 |
|
Tulkarm |
Avnei Hefetz |
200 |
Source: ARIJ Database 2001
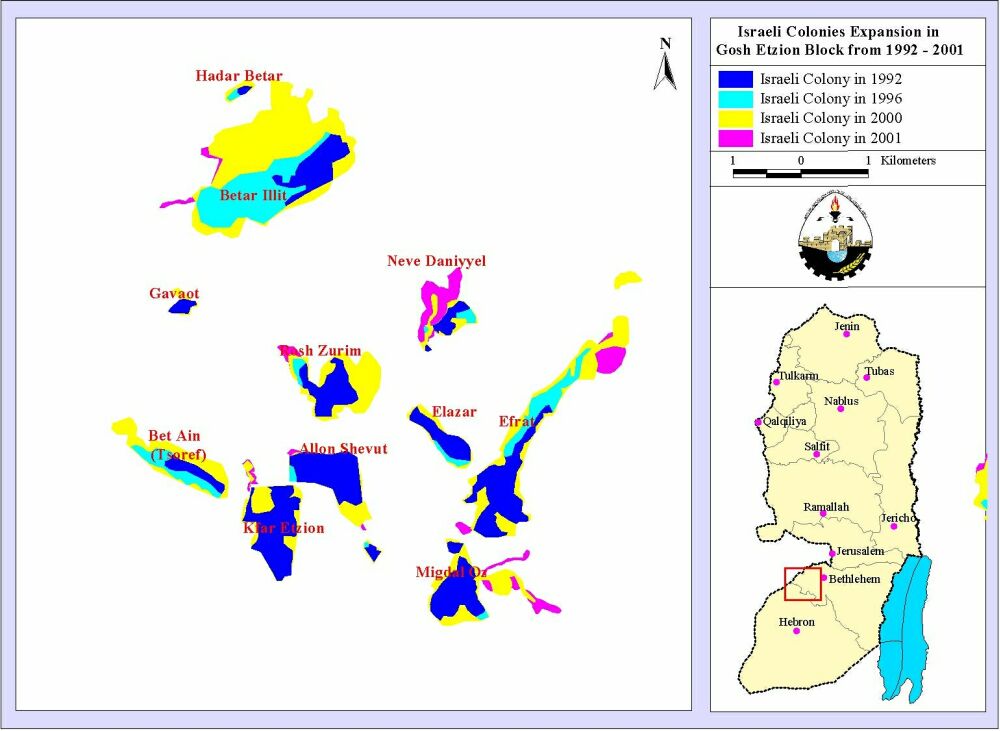
To give an example of the methodology adopted in detecting settlement expansion through satellite images , Figure 15 shows the different stages of expansion in Gush Etzion block in Bethlehem district. The different colors reflect the areas expanded in 1992, 1996, 2000 and 2001
For detailed information of the settlement expansions in each district of the West Bank during the time span 1990-2001, See Appendix A.
4.2 Gaza Strip
Through analyzing land use classifications within the settlements of the Gaza Strip, we are able to detect patterns of settlement expansion in the Gaza Strip. These land use classifications include new outposts as well as residential, agricultural, industrial and security areas. Table 6 illustrates land use classification and expansion in Israeli settlements in Gaza. Download full Table (Including Settlements land use classification)
|
|
|
Table 6: Israeli settlements in Gaza 2001 |
|||
|
District |
No. |
Settlement name |
Population |
Total Area |
|
|
Jabalya |
1 |
Dugit |
60 |
244.541 |
|
|
2 |
Dugit Site |
n.a |
11.577 |
||
|
3 |
Elei Sinai |
1983 |
200.019 |
||
|
4 |
Erez |
n.a |
565.989 |
||
|
5 |
Nisanit |
1982 |
35.139 |
||
|
6 |
Nisanit (New Site) |
n.a |
559.048 |
||
|
|
7 |
North west Elei Sinai |
n.a |
94.489 |
|
|
|
|
|
|
0 |
|
|
Gaza |
8 |
Netzarim |
291 |
320.428 |
|
|
9 |
Netzarim B |
n.a |
387.792 |
||
|
|
|
|
|
|
|
|
Khan Yunis |
10 |
Bedolah |
180 |
2062.921 |
|
|
11 |
Gadid |
1982 |
898.167 |
||
|
12 |
Gan Or |
1980 |
789.767 |
||
|
13 |
Ganei Tal |
1977 |
834.215 |
||
|
14 |
Gaza Beaches |
n.a |
132.232 |
||
|
15 |
Gaza Beaches Site |
n.a |
108.165 |
||
|
16 |
Katif |
1978 |
937.802 |
||
|
17 |
Kfar Yam |
n.a |
90.667 |
||
|
18 |
Morag |
1972 |
391.215 |
||
|
19 |
Netzar Hazani |
1973 |
616.544 |
||
|
20 |
Neve Dekalim |
1983 |
1233.337 |
||
|
|
21 |
North west Netzar Hazani |
n.a |
136.441 |
|
|
|
|
|
|
0 |
|
|
Rafah |
22 |
Atzmona (Bnei Atzmon) |
477 |
2658.298 |
|
|
23 |
Pe'at Sade |
1989 |
1058.075 |
||
|
24 |
Pe'at Sade (New Site) |
n.a |
299.136 |
||
|
25 |
Rafih Yam |
1984 |
1012.746 |
||
|
|
|
|
|
0 |
|
|
Deir al Balah |
26 |
Kfar Darom |
242 |
235.24 |
|
|
|
|
|
|
15913.991 |
|
Figure 16 depicts the abovementioned land use classifications in Israeli settlements of the Gaza Strip.
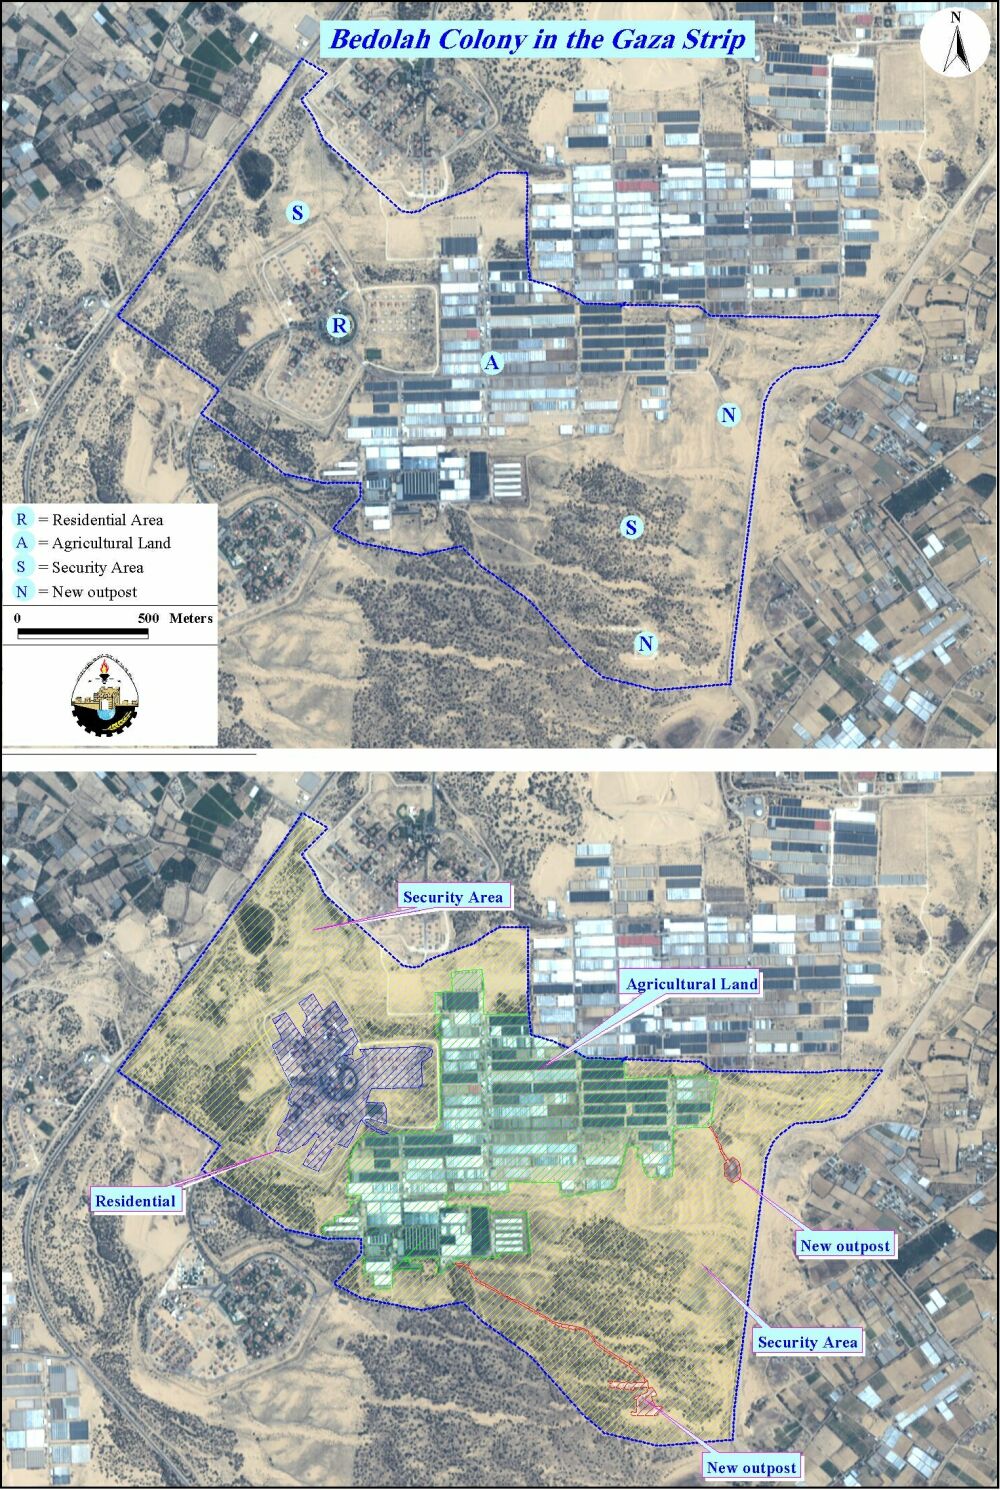
As shown in the figure, Bedolah settlement in Khan Yunis district is made up of four areas: security area shaded in yellow, agricultural area shaded in green, residential area shaded in blue and new outposts (expansions). Bedolah settlement including these areas constitutes 5.6% of the total Jewish settlement area.
5.Most Recent Colonizing Activities
1- Jerusalem (May 2002)
A bid to construct 957 colonial residential units was issued by the Israeli Ministry of Housing. These residential units will be concentrated on settlements around Jerusalem as follow:
|
Settlement name |
Number of units |
|
Givat Hazeit |
339 |
|
Betar Illit |
244 |
|
Maale Adummim |
244 |
|
Givat Benyamin (Adam) |
76 |
|
Har Adar |
74 |
2-Bethelhem (May 2002)
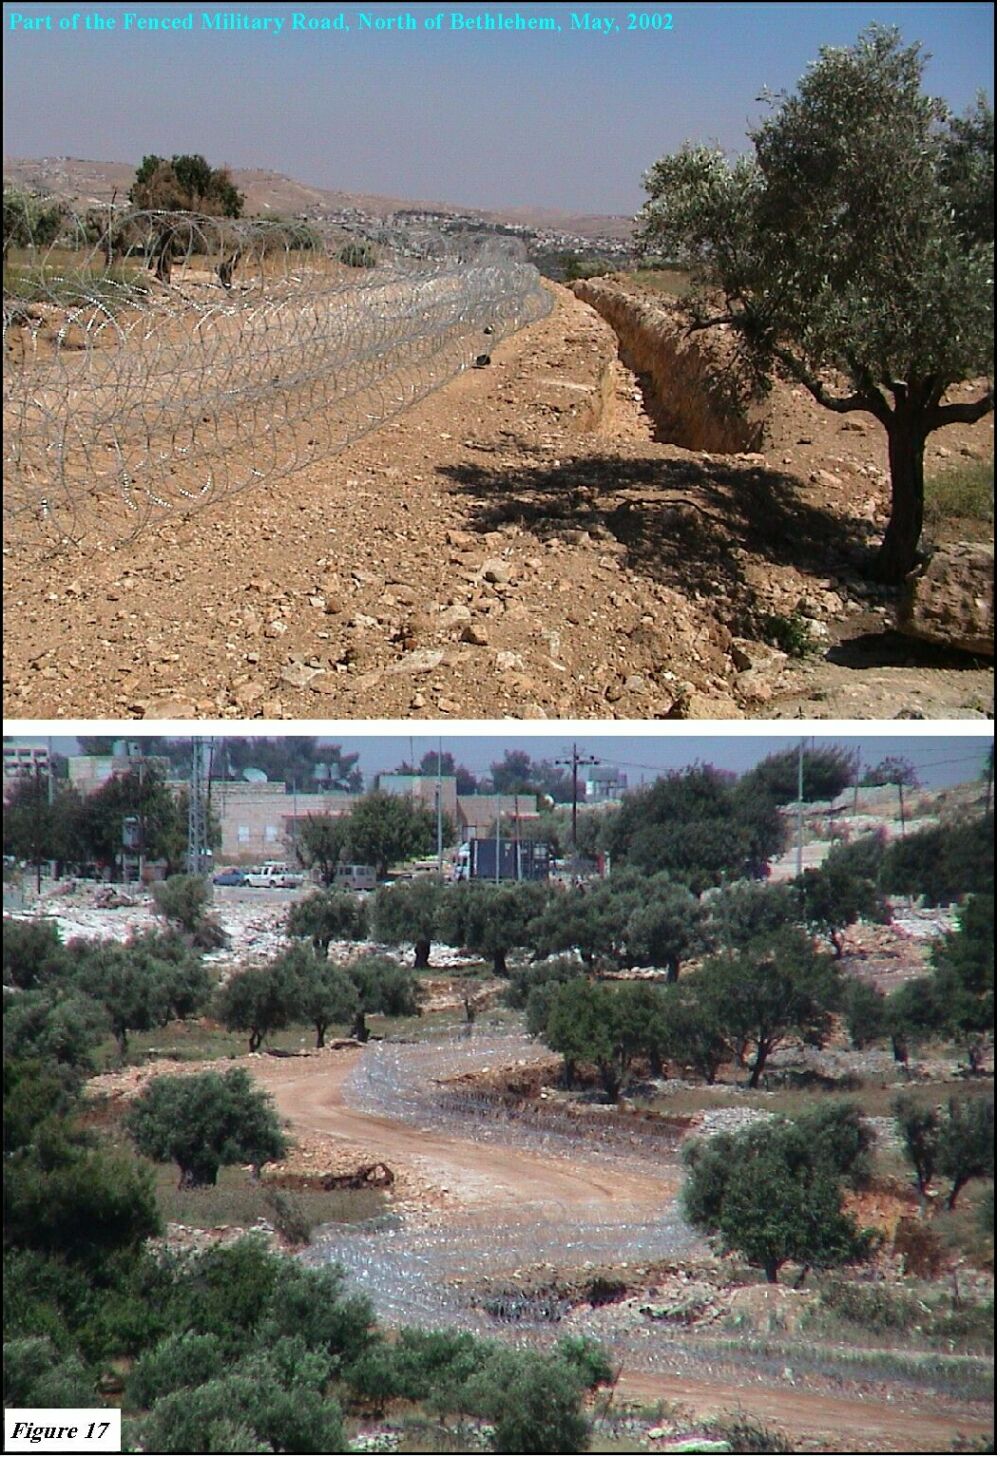
The Israeli government is continuing its establishment of a new separation zone to the north of Bethlehem district. This security zone will result in the annexation of 15 Km2of total area of Bethlehem district. The new military road will be connected to Road 60 from the west and with Abu Ghunaim settlement from the east ( click for more details ). See Figure 17
The table below clarifies the data collected from both fieldwork and satellite image analysis.
|
|
Total |
Existing |
Planned |
|
Total length of the fenced military road |
14.5 |
11 Km |
3.5 Km |
|
Total aggravated area |
0.29 Km2 |
||
|
Total area to be annexed (inaccessible to Palestinian) from Bethlehem district* |
15 Km2 (i.e.2.5% of Bethlehem district area) |
||
source: ARIJ GIS database 2002.
* According to PNA district boundaries
3-In Bethlehem (February 2002)
Israeli government commenced the construction of a new 'bypass road' southeast of Bethlehem. The road will be constructed over Palestinian farmers' land of Beit Sahour and Bethlehem; also from Za'atra, Ras-El Wad, Tekoa, Al-Shwawreh and Al-Fureidis villages. Military order number 02/02/C was issued by Yitshak Etan, the IDF commander in the occupied territories, and stated that the land was seized for military use ( click for more details ). The following data collected from both Satellite image and fieldworkers:
|
Road length |
5.5 Km |
|
Asphalt area |
90 Dunums |
|
Total area, including security buffer zone (to be confiscated) |
740 Dunums |
4-In Bethlehem (January 2002)
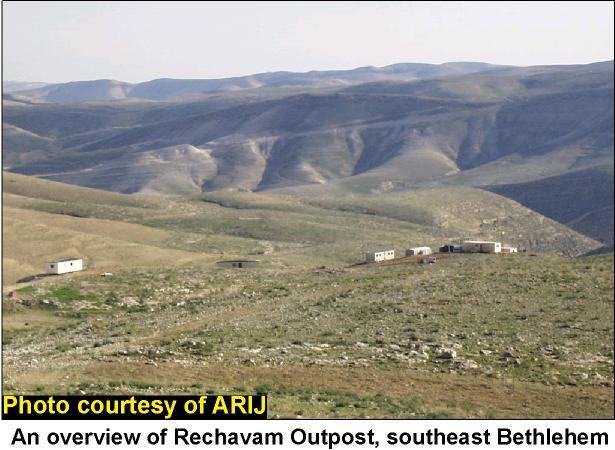
A group of settlers have started establishing a new illegal outpost in Bethlehem, which has been given the name of ' Rechavam Ze'evy ' after the late Israeli minister slain on October 17th. Also a two kilometer road with a width of 10 meters is under construction. This road will connect the existing El David settlement with the new outpost, (click for more details)
5- In Gaza strip (January 2002):
A House demolition campaign in Rafah. Under the complete darkness at a cold night on Thursday 10/1/2002, the Israeli military forces accompanied by bulldozers stormed a crowded populated quarter at Rafah Refugee camp and demolished 73 houses without evacuating any of its contents of furniture, equipment and others. At the sunrise of the next day, 123 families totaling more than 800 people were becoming homeless and refugees again. Of the last version of refugees, 350 students did not find their books, clothes and school bags. They were not able to go for their final mid-year exams.
6- In Jerusalem (January 2002):
A House demolition campaign in Al Isawiya. The residents of Al Isawiya woke up on the morning of 14/1/2002 at the noisy sound of huge bulldozers and more than 500 security men surrounding the village from all its entrances. They started demolishing 9 houses composed of 13 apartments belonging to 13 families totaling 78 people more than half of them are children.
7- In Bethlehem (December 2001):
Israeli bulldozers, guarded by tanks, have recently begun their first stage-work towards opening a new military road south east Har Homa settlement, which consequently will cause the destruction of 9 square kilometer of agricultural land. Israel, by constructing this road, is further expanding the illegal boundaries of Jerusalem, annexed after the 1967 war,( click for more details)
Till December 27, data calculated from field surveys are as follow
|
Total length of the new military road |
8.2 Km |
|
Paved |
2.5 Km |
|
Under construction |
6 Km |
|
Total length of the Existing military road |
2 Km |
Source: ARIJ GIS Da2001tabasse
8-In Bethlehem (October 2001):
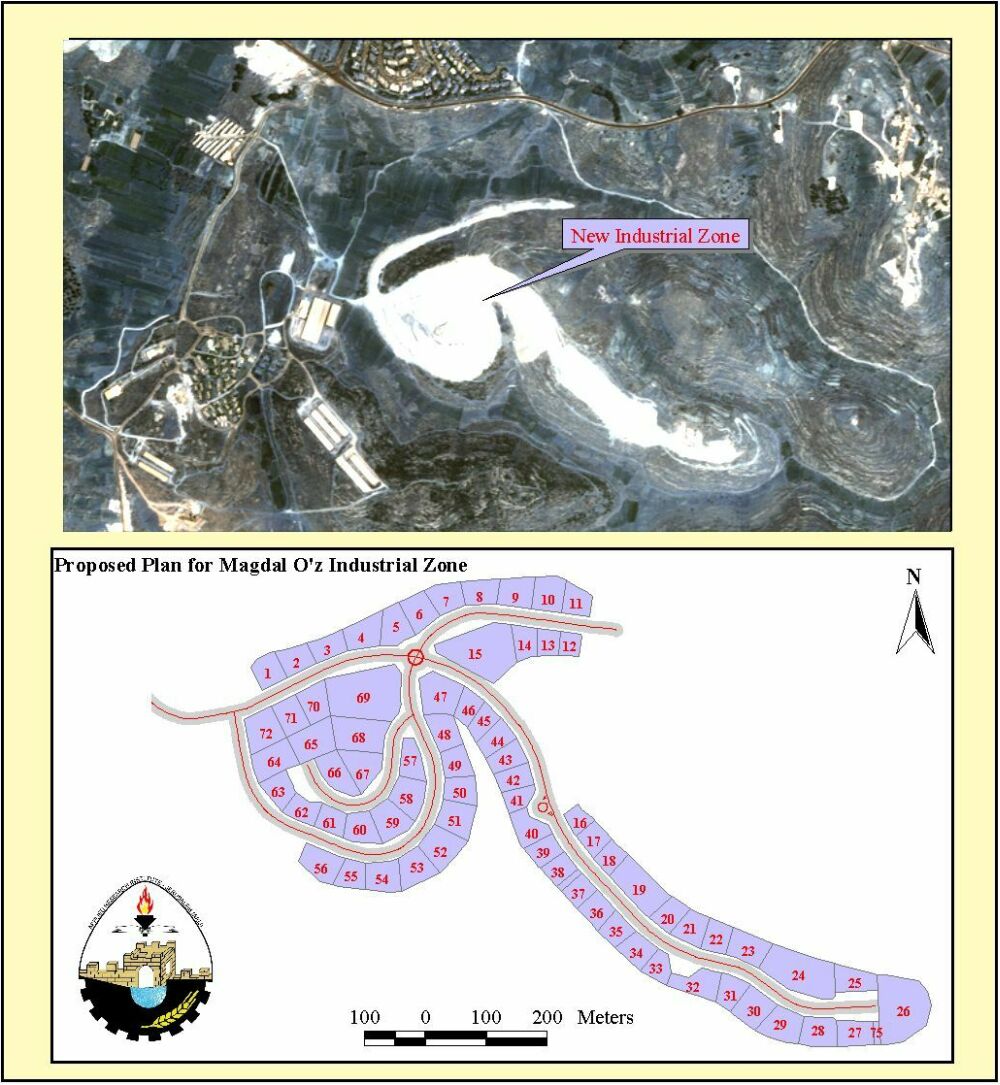
About 200 Dunums of Beit Ummar area has been fully confiscated for the sake of establishing 'Migdal OZ industrial zone'.The confiscated agricultural area lies on the northern side of Hebron Mountains and belongs to farmers from Beit Ummar and Beit Fajar villages. The villagers filed suites against the military order; they raised the appeal via humanitarian organization but never got a response from the Israeli High Court of Justice. Meanwhile, on the ground, the Israeli bulldozers have continued their work. The proposed industrial zone 'DER 'ALA' or [Bricot] will consist of around 72 industrial blocks that will be stemmed on part of the Palestinian town of Beit Ummar (click for more details ); See Figure 18.
9-In Jerusalem (December 2001):
Two hundred houses are due to be build inside the old city, near Bab Al-Sahreh. Arial Sharon first declared this colonizing plan when he was the housing Minister back in 1990. His successor in Luked Party, Benjamin Netanyahu, began the construction process in 1998 followed by inhabiting 12 Israeli settlers. The plan behind this action is to get into the Islamic Quarter in order to terminate the on ground partitions of the old city, which have been agreed upon during Camp David negotiations.
Final Remarks
It is important to point out that throughout the Al Aqsa Intifada, events have been unfolding at such a quick pace that monitoring and recording them has proved a very difficult task. This is especially true when it comes to checkpoints and roadblocks. Because there has been international condemnation every now and then over Israeli policies, the Israelis have been playing a game of cat and mouse with the international media. Whenever they feel that the international media is unaware or looking the other way, they implement stringent restrictions on the Palestinians. However, when the world is watching, Israel puts on the cloak of civility and lifts the restrictions. Therefore, on several occasions, monitors and international solidarity groups come to the occupied territories to witness the Israeli abuses only to find that there is nothing. But after they are gone, the true face of Israel comes to light. Unfortunately, it is only the Palestinians that get to see this face.
Conclusion
It is important to recall here that United Nations Security Council Resolutions 242 and 338 ' emphasize the inadmissibility of the acquisition of territory by war and the need to work for a just and lasting peace in which every State in the area can live in security and affirms that the fulfillment of Charter principles requires the establishment of a just and lasting peace in the Middle East which should include the application of both the following principles:
-
Withdrawal of Israeli armed forces from territories occupied in the recent conflict;
-
Termination of all claims or states of belligerency and respect for and acknowledgement of the sovereignty, territorial integrity and political independence of every State in the area and their right to live in peace within secure and recognized boundaries free from threats or acts of force;'
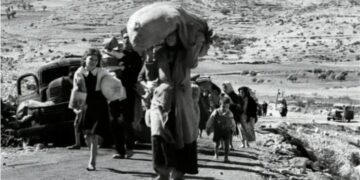
These resolutions also ' affirm further the necessity for achieving a just settlement of the refugee problem; and requests the Secretary General to promote agreement and assist efforts to achieve a peaceful and accepted settlement in accordance with the provisions and principles in this resolution; 'All Israeli settlements in the West Bank and Gaza are illegal according to International Law. Article 49 of the Fourth Geneva Convention specifically states that: 'The Occupying Power shall not deport or transfer parts of its own civilian population into the territory it occupies'.
For the Palestinians, 'Madrid' and 'Oslo' heralded the prospect of a State, and guaranteed an end to the occupation and a resolution of outstanding matters within an agreed time frame. Palestinians are frustrated at the continued growth of settlements and at their daily experiences of humiliation and disruption as a result of Israel's presence in the Palestinian territories. Palestinians see settlers and settlements in their midst not only as violating the spirit of all agreements ratified by both sides, but also as an application of force in the form of Israel's overwhelming military superiority, which sustains and protects the settlements.
Furthermore, the ongoing fragmentation of Palestinian land and communities into disconnected cantons combined with the frequent collective punishment of closures, house demolitions, withdrawal of identification cards, the confiscation of private property will and the military bombardment of the past year impose a physically unsustainable situation.
Any resolution to the conflict should not take into consideration the facts that Israel has illegally created on the ground (as they are always manipulated by Israeli colonization and occupation policies) but should take into account justice as a premise for sustainable peace. It is becoming clear that the solution for the conflict requires the dismantlement of all settlements as well as the displacement of the settlers without any exception, including what the Israeli government alludes to as 'neighborhood'. This is not unrealistic, unthinkable but inevitable. Israel can easily absorb the 400,000 settlers inside Israel. As a matter of principle, Israel should not be allowed to get away with its defiance of the international legitimacy and thus, the American attempt to consolidate the settlements will not be acceptable to Palestinians.
Israel has recognized the geographical integrity of the West Bank and Gaza Strip, i.e. there should be tangible contiguity between them. This contiguity could be achieved through minor territorial exchange and dismantlement of Jewish settlements to facilitate the absorption of Palestinian returnees.
To reiterate, a lasting peace can only be based on United Nations Resolutions 242 and 338, in which a fully sovereign Palestinian state will be established based on the Palestinian land occupied by Israel in 1967, neighboring a secure and independent Israeli state. For Israel to demonstrate its readiness to comply with these resolutions and the Mitchell commission report , Palestinians need to see actions on the ground including:
-
Lifting of the one year old blockade imposed on Palestinians
-
Abolition of the closed areas orders including the separation zones
-
Total freeze on all settlements expansions and by pass roads construction
-
Beginning of dismantling settlements in hot spots such as Gaza and Hebron
-
Dismantlement of all 'illegal' outposts
-
Allowing international inspection of all settlement activities
-
Cancellation of all privileges and incentives given to settlers.
APPENDIX A
-
Israeli settlements in Hebron District
-
Israeli settlements in Bethlehem District
-
Israeli settlements in Jerusalem District
-
Israeli settlements in Jericho District
-
Israeli settlements in Ramallah District
-
Israeli settlements in Salfit District
-
Israeli settlements in Tubas District
-
Israeli settlements in Nablus District
-
Israeli settlements in Qalqilyia District
-
Israeli settlements in Tulkarem District
-
Israeli settlements in Jenin District
APPENDIX B
A Focused Case Study on Israeli Colonization
Spatial and Temporal Trends of Israeli Colonizing Activities In Bethlehem and Hebron Districts: Israeli colonization of the West Bank since the start of the occupation in 1967 has been a defining feature of urbanization in the region. Such colonization has been, and continues to be, one of the main obstacles to sustainable development and future planning in the Palestinian territories. The development of Israeli settlements on confiscated Palestinian land is motivated by a desire to obtain control over more Palestinian land and to effectively lay siege to the main Palestinian cities by creating new bypass roads and peripheral settlements. The campaign of heavy colonization in the West Bank limits further expansion and development of Palestinian areas.
It important to identify how the factors contributing to Israeli urban growth in the study region differ in kind from those which are driving Palestinian urbanization. Palestinian land development reflects the need for expanded settlements due to population growth. In contrast, the motivation behind Israeli colonization is a purely political one, to establish human settlements in order to break up the continuity of the Palestinian land.
The study districts of Bethlehem and Hebron have both suffered from rapid colonizing activities, which are still taking place at the present time. The figure below gives an indication of the time frame on which the Israeli colonization has operated (ARIJ survey, 2001). It is evident that the most severe period for settlement establishment in Bethlehem district was during the 1970s, and for Hebron district, during the 1980s. However, even though the majority of the settlements in both regions had been established by the start of the 1990s, all of the settlements have expanded rapidly since that date.

Map 1 shows the distribution of the settlements in Bethlehem district, and how that distribution changed between 1990 and 1999.
The map indicates that the distribution of these settlements and the bypass roads serving them form a ring around Bethlehem built up areas. Such a ring constrains new development and causes fragmentation to the Palestinian land. The close proximity of Bethlehem to Jerusalem is part of the reason for the high growth in colonizing activities in this district, with plans proposed to expand the municipal boundary of Jerusalem into the northern part of Bethlehem district.
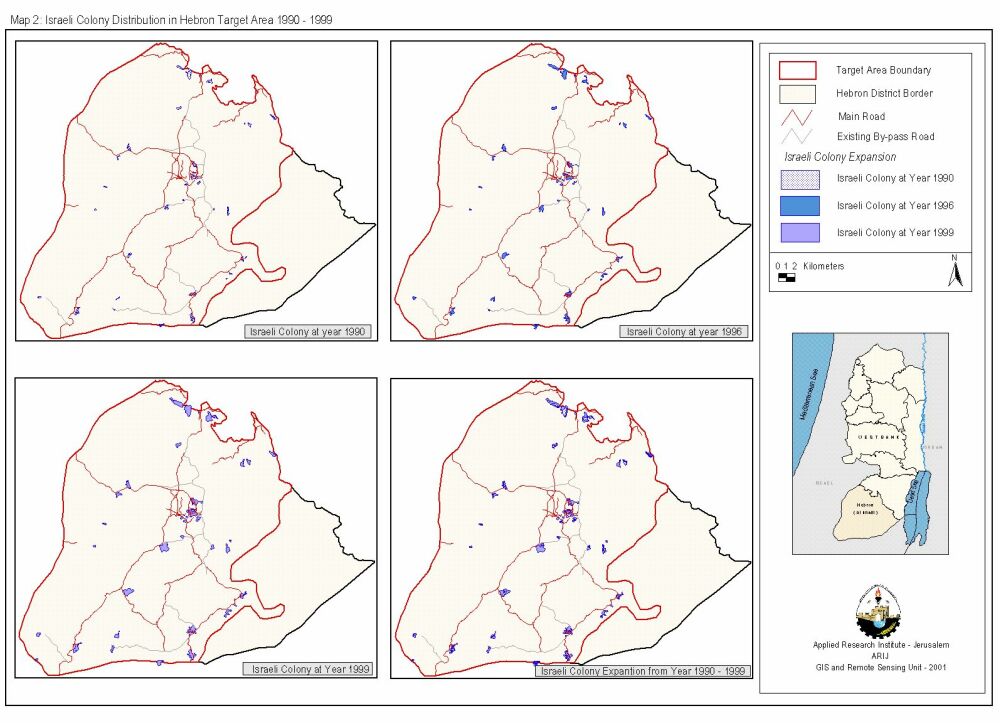
Map 2 shows the distribution of Israeli settlements in Hebron district from 1990 to 1999.
It is clear that the settlements are more scattered in this region than they are in Bethlehem district. This allows for the development of more coherent Palestinian urban areas. The reason for this dispersal of Israeli settlements in this region is the concessions of the Israeli-Palestinian peace talks, in which substantial areas of land were returned to the authority of the Palestinians (by being designated as Area B).
Yet Hebron is unique in the West Bank, as the only city where the settlements actually occupy a central position, within the central city boundaries (See Photo below). There are 20,000 Palestinians and approximately 200 permanent Jewish settlers living in H-2, the core region in which Israel retains control over internal security and public order. The Jewish numbers are supplemented by a further 200 Jewish settler supporters who come in the daytime from other settlements in the West Bank. The presence of an outside settler population obviously has a significant impact on the urban fabric. Local people say that over half the Palestinian population residing in the H2 area have moved into area H1 because of the continuous harassment and hardships they face every day.
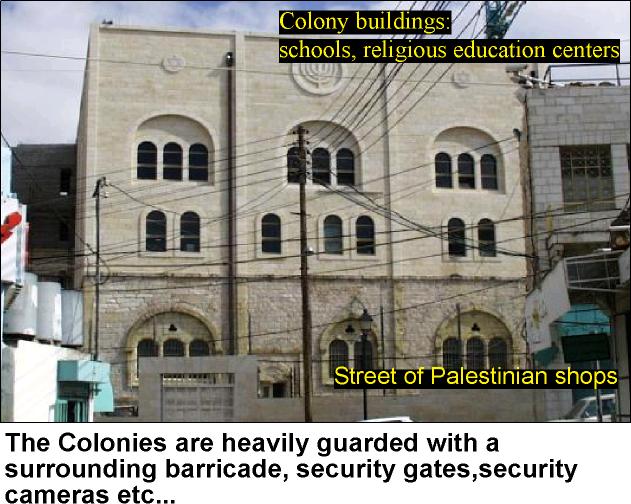
Beit Romano Israeli settlement in the center of Hebron city
So as to investigate the spatial expansion of the Israeli settlements in the two districts over the study period, Land sat TM images from 1990, 1996 and 1999 were utilized. Tables 1 and 2 show the date of establishment for each settlement (where known) and the spatial expansion in Bethlehem and Hebron districts. Table 1: Establishment and Spatial Expansion of Israeli settlements in Bethlehem District, as calculated from Land sat TM images
|
Settlement Name |
Establishment date |
Area in Dunums |
Status |
Growth Rate(% area/decade) |
||
|
1990 |
1996 |
1999 |
||||
|
Allon Shevut |
1971 |
461.84 |
530.42 |
704.50 |
Expanded |
52.50 |
|
Betar Illit |
1989 |
850.03 |
1924.56 |
3143.84 |
Expanded |
269.85 |
|
Caravans (north of Efrat) |
NA |
0.00 |
0.00 |
64.20 |
New Development |
– |
|
Efrat |
1979 |
1186.08 |
1737.97 |
2065.67 |
Expanded |
74.16 |
|
El David |
NA |
62.66 |
62.66 |
62.66 |
Not Expanded |
0 |
|
Elazar |
1975 |
439.83 |
439.83 |
439.83 |
Not Expanded |
0 |
|
Gavaot |
1984 |
59.21 |
59.21 |
83.97 |
Expanded |
41.82 |
|
Gilo |
1971 |
3727.43 |
3727.43 |
3727.43 |
Not Expanded |
0 |
|
Givat Hamatos |
1991 |
0.00 |
267.89 |
267.89 |
Not Expanded |
0 |
|
Hadar Betar |
1978 |
71.13 |
73.82 |
73.82 |
Not Expanded |
3.78 |
|
Har Gilo |
1976 |
402.61 |
402.61 |
402.61 |
Not Expanded |
0 |
|
Har Homa |
1997 |
0.00 |
0.00 |
2147.39 |
New Development |
– |
|
Neve Daniyyel |
1982 |
228.72 |
281.27 |
467.14 |
Expanded |
104.24 |
|
Noqdim |
1982 |
153.85 |
232.43 |
300.74 |
Expanded |
95.48 |
|
Northern Kfar Etzion |
1967 |
113.05 |
113.05 |
113.05 |
Not Expanded |
0 |
|
Rosh Zurim |
1969 |
792.84 |
891.15 |
891.15 |
Not Expanded |
12.40 |
|
Tekoa |
1977 |
371.09 |
687.26 |
743.09 |
Expanded |
100.25 |
|
Total area of Israeli Colonization |
8920.37 |
11431.56 |
15698.98 |
Overall Growth Rate:76.00% area/decade |
||
Table 2: Establishment and Spatial Expansion of Israeli settlements in Hebron district, as calculated from Land sat TM images.
|
Settlement Name |
Establishment date |
Area in Dunums |
Status |
Growth Rate (% area/decade), if expanded |
|||
|
1990 |
1996 |
1999 |
|||||
|
Adora |
1982 |
41.38 |
73.45 |
247.07 |
Expanded |
497.08 |
|
|
Asfar ( Mitzad) |
1983 |
112.00 |
137.05 |
188.77 |
Expanded |
68.54 |
|
|
Bet Ain (Tsoref) |
1989 |
156.31 |
351.97 |
723.67 |
Expanded |
362.97 |
|
|
Eshkolot |
1982 |
70.10 |
99.20 |
170.32 |
Expanded |
142.97 |
|
|
Hagai |
1984 |
155.56 |
295.79 |
988.97 |
Expanded |
535.75 |
|
|
Har Manoh |
1982 |
25.08 |
32.44 |
86.12 |
Expanded |
243.38 |
|
|
Hebron Jewish Quarter |
1967 |
41.13 |
66.06 |
104.81 |
Expanded |
154.83 |
|
|
Settlements inside Hebron Old City |
NA |
194.80 |
194.80 |
194.80 |
Not Expanded |
0 |
|
|
Karmei Zur |
1984 |
118.04 |
163.03 |
237.84 |
Expanded |
101.49 |
|
|
Karmel |
1981 |
110.40 |
152.99 |
207.38 |
Expanded |
87.84 |
|
|
Kfar Etzion |
1967 |
460.48 |
597.26 |
856.56 |
Expanded |
86.01 |
|
|
Maale Amos |
1981 |
92.07 |
117.24 |
219.63 |
Expanded |
138.55 |
|
|
Maale Havar (Pene Hever) |
1983 |
152.38 |
216.59 |
313.44 |
Expanded |
105.70 |
|
|
Maon |
1980 |
45.31 |
121.15 |
224.36 |
Expanded |
395.17 |
|
|
Mezadot Yehuda (Beit Yattir) |
1977 |
276.62 |
404.64 |
539.40 |
Expanded |
95.00 |
|
|
Migdal Oz |
1977 |
185.69 |
261.95 |
816.38 |
Expanded |
339.65 |
|
|
Mitzad Shimon |
1991 |
11.16 |
19.28 |
270.12 |
Expanded |
2320.43 |
|
|
Nahal Adurim (Doran) |
1979 |
32.08 |
44.50 |
69.57 |
Expanded |
116.86 |
|
|
Negohot |
1984 |
23.92 |
34.44 |
56.82 |
Expanded |
137.54 |
|
|
Otniel |
1980 |
156.66 |
323.62 |
713.07 |
Expanded |
355.17 |
|
|
Qiryat Arba |
1968 |
392.53 |
480.40 |
655.10 |
Expanded |
66.89 |
|
|
Ramat Mamre (Kharsine) |
NA |
225.24 |
355.57 |
572.10 |
Expanded |
154.00 |
|
|
Shani (Livneh) |
1990 |
82.83 |
165.24 |
335.42 |
Expanded |
304.95 |
|
|
Shima |
1989 |
33.97 |
102.30 |
214.81 |
Expanded |
532.35 |
|
|
Susiya |
1983 |
174.71 |
333.33 |
707.56 |
Expanded |
304.99 |
|
|
Telem |
1982 |
146.38 |
242.87 |
317.76 |
Expanded |
117.08 |
|
|
Tene (Maale Omarim) |
1982 |
195.71 |
265.17 |
446.26 |
Expanded |
128.02 |
|
|
TOTAL AREA OF ISRAELI COLONIZATION |
3712.54 |
5652.33 |
10478.11 |
Overall Growth Rate: 182.24% area/decade |
|||
|
Note: |
|
||||||
It is evident from Tables 1 and 2 that the rates of expansion in the expanded settlements have been very substantial. The growth rate of the Israeli settlements in the past 10 years has been at a high rate especially in Hebron, which exhibits higher growth rates than Bethlehem district. The growth rate of the Israeli settlements in Hebron has been 182.24% per decade, in comparison to a growth rate of 76% in Bethlehem.
The fastest spatial expansion in Israeli settlements in Bethlehem district over the last decade (1990 – 1999) has been in Betar Illit settlement in the far western part of the district. Betar Illit is one of the most rapidly expanding settlements in the West Bank. This settlement, and neighboring Hadar Betar settlement, represent development that is occurring on land that lies between the three Palestinian villages of Husan, Wadi Fukin and Nahhalin, taking their land and threatening their very existence. Close by on the other side of the 1949 Armistice line there are the Israeli towns of Mevo Betar and Zur Hadassa. The close location of Hadar Betar and Betar Illit to the 1949 Armistice Line and their proximity to the Israeli town of Mevo Betar on the other side of the line make these settlements likely targets for formal annexation to Israel in the future. The continuation of construction on a large scale at Betar Illit indicates a high degree of confidence, on the part of investors, that the area of this settlement will remain under Israeli control for the foreseeable future.
The 1990s also saw significant expansion in the settlements of Tekoa and Noqdim in the southeast of the Bethlehem district, completing the circle of development around Bethlehem city center. In Hebron district, where there are a larger number of settlements, scattered over the whole region, the highest rates of spatial expansion have been in Mitzad Shimon settlement. Mitzad Shimon grew from only a small settlement of 11 Dunums at the start of the decade, to a substantial urban area of over 270 Dunums by 1999. The growth in the Mitzad settlements brings the de facto borders of these settlements up to the closed military area, which consumes the easternmost portion of the district. Additionally, one Palestinian village, Arab er Rashiydeh, has been enveloped by the confiscation around Mitzad; its existence is certainly now threatened.
Although the Israeli-Palestinian peace negotiations have allowed the Palestinians to control part of their land and utilize some of their natural resources, they have not stopped the colonizing activities. This is evident in Table 3, which indicates that the spatial growth rate of the Israeli settlements has in fact increased in Bethlehem and Hebron since 1996. During the post-self autonomy period the growth in Bethlehem Israeli settlements was 9% higher than it was during the period 1990 – 1996. The Hebron settlements show an even higher increase in growth rate, with growth being 33.13% higher during the PNA autonomy period in comparison to the period between 1990 and 1996.
Table 3: Growth rate in the Israeli Settlements
|
|
1990 – 1996 |
1996 – 1999 |
|
Bethlehem |
28.15% |
37.33% |
|
Hebron |
52.25% |
85.38% |
The total amount of land utilized for colonizing activities in the year 2000 was approximately 15,281 and 11,590 Dunums for Bethlehem and Hebron districts respectively.
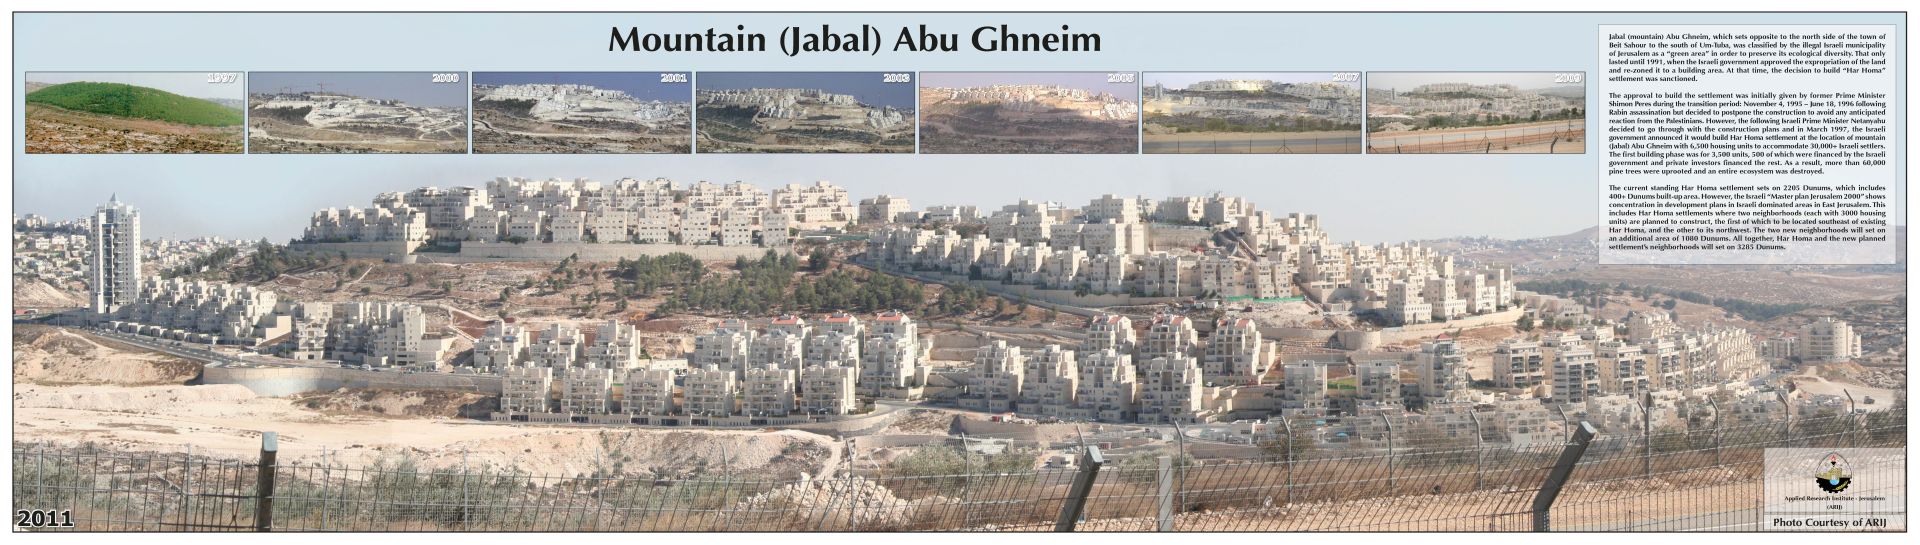
Furthermore, the effects that Israeli settlements have on the environment of the West Bank are varied and severe in their scope. For example, a recent study addressing the status of transportation in the West Bank by Maoh & Isaac (1999) found that the total emissions of major pollutants from cars maybe 27% – 32% higher in the West Bank due to the presence of the settler vehicles. These settlers live in the West Bank Israeli settlements but commute to Israel for work everyday. Within the study area, of particular significance is the case of Har Homa settlement, established in 1997 on Abu Ghunaim mountain in the north of Bethlehem district. This mountain had previously been designated a forested nature reserve by the Israeli authorities. In order to accommodate the urban development, the whole mountain has been deforested (See Photos below).
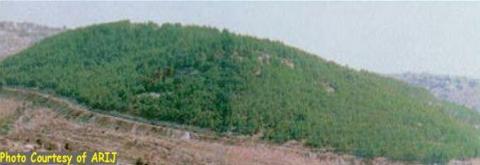
Abu Ghunaim Mountain, prior to March 1997
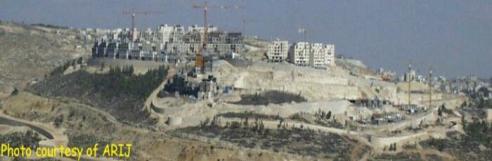
Abu Ghunaim mountain, 3 January 2001
Appendix C
Financial Incentives offered to Israeli Settlers:
-
Settler family income in Alkana settlement reached 17,000 NIS per month in 2000, whereas the average Israeli income in 2000 did not exceed 10,300 NIS per month.
-
Settlers receive a tax exemption of 7%
-
Expenditure on security reached 900 million NIS/ year
-
Industries in settlements receive $46 million in grants and 22 million NIS allocation from the Ministry of Industry.
-
Settlements received $18 million from the Ministry of Tourism.
-
Every settler is granted 80,000 NIS from the Ministry of Housing.
-
In 2000, the IDF spent 150 million NIS on roads in settlements while 22 million NIS came from the Transportation Ministry.
References
-
ARIJ (Applied Research Institute-Jerusalem), Geographic Information System (GIS) Database, Bethlehem, 1996-1998.
-
Israeli-Palestinian Interim Agreement on the West Bank and Gaza Strip Oslo II, Washington, Ministry of Foreign Affairs, Jerusalem, September 1995.
-
PCBS (Palestinian Central Bureau of Statistics), Preliminary results for the census of population and Establishments-1997.
Prepared by:
The Applied Research Institute – Jerusalem