Introduction
The data that appears in the monthly, quarterly and comprehensive reports is collected from Palestinian and Israeli newspapers, satellite images, aerial photos, fieldworkers' reports, ARIJ and LRC verification and reports from other organizations. The reports that are received are divided up according to the agreed classifications. These classifications and their definitions are as follows:
|
C = Construction; any increase in Israeli built-up areas |
|
D = Demolition; any destruction of Palestinian assets |
|
E = Expansion; any increase in land occupied by Israelis |
|
I = Issuing an order for demolition, confiscation etc. |
|
O = Other; a general category that includes all incidents that do not fit into any of the specific categories. |
|
P = Plans; plans issued for acts in any other category, or attempts at violations such as attempts at seizure. |
|
R = Roads; any increase in the road network or changes in road blocks |
|
S = Seizure; confiscation, eviction, occupation and any sort of asset grabbing |
|
U = Uprooting trees |
|
V = Violence and Harassment. In general we do not count incidents of violence inflicted by the Israeli army, but only those caused by settlers*. |
*Where an act of violence or harassment by the army has a clear colonizing impact (such as shooting at farmers to prevent them entering their fields) then we do include it as an incident. But violence and harassment on other occasions, such as at demonstrations, is not counted here.
Some incidents are counted twice when they involve violations in two different categories. For example, work on a by-pass road might include the uprooting of a large number of trees, and will be counted as both R and U.
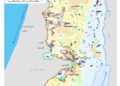
Incidents are also categorized as to the district they occurred in. This year (2000-2001) the districts used are eight in the West Bank (Nablus, Jericho, Jenin, Jerusalem, Ramallah, Hebron, Bethlehem and Tulkarm) and the Gaza Strip. However, from February 2001, the PNA's official districts will be used (these include in addition to those mentioned: Salfit, Tubas and Qalqilyia). It was not possible to use these districts initially as their borders had not yet been confirmed. This change in districts will make it somewhat harder to compare the results of the first year with those of the second but it will make the collection of data easier and more consistent with the structure of the PNA; see map.
The final way in which events are categorized is according to violator. For this section there are two categories; Israeli Authorities and settlers. Authorities include any official body, not only governmental but also building organizations and telecom companies. The aim of this division is to be able to locate changes in the rate of activity of settlers. Although settlers usually act with army protection, their actions tend to be more lawless and random.
There are a number of problems with the reports from newspapers. Care is taken to avoid double counting events that appear twice on different days in different newspapers. This is often not as simple as it sounds, as newspapers sometimes choose a variety of spellings for settlements, or may refer to the same person by different names. The greatest difficulty with newspaper reports is the figures they contain. It takes training and experience to estimate large numbers of trees and areas seized or bulldozed. In addition to the lack of training, owners of damaged property are understandably distressed and this often seems to lead to over estimates. Newspaper reporters may be members or relatives of members of the village, making it hard to obtain objective reports. Despite all efforts taken, the database of incidents collected cannot be considered to be a complete list of all incidents in the above categories. More fieldworkers are needed to ensure that this database becomes more fully comprehensive over the next year of the project.
Effort is made to verify all newspaper reports. However, due to the large number of incidents and relatively small number of fieldworkers, it has not been possible to check many of the cases. Furthermore, as the Israeli army has imposed the blockades and closures, it has become more difficult to travel to the location of incidents. It has been necessary to rely more and more on the fieldworkers and less verification has been made directly by the partner organizations. Of course, the fieldworkers have also been affected by the closure and blockades leading to many incidents coming only from newspaper reports. In order to overcome the lack of reliability in the data sourced from newspapers, in general in this report only incident numbers have been counted, instead of numbers of trees and areas of land. From this data it is possible to gain a picture of those areas worst affected, changes over the time period and patterns arising in the kinds of violations being committed. For the case of uprooted trees an estimate of the numbers damaged has been given, however this figure is expected to be an underestimate as all those incidents without estimates of the numbers of trees were ignored.
Further difficulties arise with the data as a result of it having been collected by two separate institutes. While compiling this comprehensive report, work has needed to be done to make the date consistent, and further work needs to be done to improve the data collection and categorization for subsequent years.
RESULTS
1. Violations
1.1 Number of incidents
A total of 715 colonizing incidents were recorded between February 2000 and January 2001, 545 in the West Bank and 167 in Gaza. The rate at which incidents occurred varied considerably through the year. Figures 1 & 2 most clearly show the impact that the Al Aqsa Intifada has had on the number of incidents occurring in the occupied territories. The Intifada began on 29th September 2000.
Figure 1:
Figure 2:
1.2 Types of violation
In the West Bank, the largest category of incident this year has been 'Uprooting trees'. The Intifada has seen a particular upsurge in this incident with the army becoming renowned for uprooting large areas of land (particularly olive trees) under the pretext of security. Figures three and four show how the incidents are divided between the categories in the West Bank and Gaza Strip. Although the absolute number of tree uprooting incidences is lower in Gaza than in the West Bank, when one considers the relative sizes of the two areas it can be seen that the tree damage in Gaza has been more intense.
Figure 3:
Figure 4:
Certain types of violations have increased more rapidly since the beginning of the Al Aqsa Intifada (29th September 2000). The West Bank has seen particularly notable rises in incidents involving roads, expansion, uprooting trees and others; see Figure five.
Figure 5:
Both the categories of 'uprooting trees' and 'violence and harassment' peaked in the first few months of the Al Aqsa Intifada in the West Bank. These incidents saw a lull in occurrence from December but did not drop back to the levels before the beginning of the Intifada.
Figure 6:
The Gaza Strip has seen dramatic increases in the rate of demolition, uprooting of trees, expansion and other violations and has not seen the occurrence rate drop as it has in the West Bank; see Figure six. The Gaza strip has been severely hit by the Israeli army's policy of demolishing buildings and olive groves under the pretext of 'security'.
Figure 7:
The table below, together with figure eight, gives an estimate of the numbers of trees uprooted and destroyed over the past year in both the West Bank and Gaza. The huge surge in this type of destruction since the start of the Intifada can be seen clearly. Over 97% of the trees that were uprooted this year were damaged between October 2000 and February 2001
|
|
Number of Uprooted Trees |
|
February '00 |
817 |
|
March |
9 |
|
April |
501 |
|
May |
300 |
|
June |
55 |
|
July |
320 |
|
August |
610 |
|
September |
60 |
|
October |
3,330 |
|
November |
42,480 |
|
December |
17,486 |
|
January '01 |
24,606 |
|
Total |
90,574 |
Figure 8:
In the West Bank, construction violations have in fact decreased since the beginning of the Al Aqsa Intifada, perhaps because of a shift in priorities or as a result of reduced investor confidence. The rates of seizures and demolitions in the West Bank have not been appreciably affected by the change in political environment; see figure nine.
Figure 9:
2. Location
2.1 Districts
As mentioned in the introduction, the incident events in the West Bank are categorized according to the district in which they occur. This year, eight district divisions were used. By counting the number of incidents occurring in each district we can locate which areas suffer most from these kinds of incidents; see map1, map2, map3., , .

 v
v
Figure ten shows the percentage of the total number of incidents in each district in the West Bank. This includes incidents by both settlers and the Israeli authorities. Nablus experienced the largest number of incidents at 144. Hebron, Ramallah and Jerusalem were the next worst affected with 94, 91 and 88 incidents respectively. Figure 10:
More detail is provided by the break down of incidents into violations. It is found that Nablus is particularly badly affected by certain kinds of incidents. Nearly half of all tree-uprooting incidents in the West Bank occurred in Nablus District as did over 40% of the construction incidents; see Figures 11 and 12. Figure 11:
Figure 12:
Jerusalem District was notably affected by planning incidents. As stated in the introduction this category not only includes the issuing of plans for future development, but also attempts to seize land or to confiscate property. This is because such attempts are taken to be indications of the future intention of settlers.
Figure 13:
2.2 Villages
Certain villages, like certain districts, are more severely affected by Israeli violations than others; see map.
-
In Bethlehem District, 18 of the total 58 incidents (31%) affected Al Khader village. According to the 1997 Palestinian census*, this village has about 5% of the population of Bethlehem district. This small portion of the population suffers far more than the other 95% of the district.
-
In Hebron District 23% of the incidents impact on two villages (Beit Ummar and Yatta) with just 10% of the district's population.
-
In Jericho District, 4 of the 12 recorded incidents occurred in Al 'Auja village, which holds just 9% of the district's population
-
In Nablus District, almost 30% of the incidents occurred in 5 villages (Kafr Qaddum, Huwwara, Haris, Burin, Qaryut)
-
In Ramallah District, 32% of the incidents hit 6 villages (Ein Yabrud, Sinjil, An Nabi Salih, Ni'lin, Al-Mughayyir and Umm Safa). These villages have 6% of the district's population.
-
In Tulkarm, 57% of the 42 incidents occurred in just four villages (Isla, Azzoon, Jayyus, Shufa)
*Palestinian Central Bureau of Statistics
3. The Violators
The 'violators' categorization is very broad. It is merely meant to give an indication as to the amount of incidents instigated by authority and the amount instigated by groups of settlers. These groups often act with army protection, but when the initiative comes from the settlers themselves, the act has been counted as having being carried out by settlers.
In the West Bank 210 of the 564 incidents (37%) were carried out by settlers. In the Gaza Strip, settlers were responsible for 26 of the 167 incidents (16%). Figure 14:
Figure 15:

Figure 16 shows the percentages of settlers in each district in the West Bank and in Gaza, based on the population figures from 1997*. Comparing this chart with the number of incidents carried out by settlers in each district (Figure 17) shows that the number of settler violations in a particular district does not correlate with the number of settlers there. For example, Jerusalem District has 60% of the settler population but only accounts for 8.1% of the settler violations.
*Israeli Central Bureau of Statistics
Figure 16:
Figure 17:
Figures 16 and 17 can be used to calculate the activity of the settlers in each district, by dividing the percentages in Figure 17 by those in Figure 16. The ratio of the percentage of incidents in a district to the percentage of settlers in a district allows us to compare the amount of settler violations relative to the population size.
Figure 18:
The higher the ratio shown in Figure 18, the greater the number of violations per settler*. It is clear that the settlers in Gaza and Hebron are by far the most disproportionate violators. Settlers in Nablus, Ramallah and Tulkarm are the next most active violators.
*Note that the y-axis on this graph does not represent the number of violations per settler, but is directly proportional to this. The scale is actually the ratio of percentage of violations in a district to the percentage of settlers in a district.
It is shown in Figure 18that settlers in some districts are worse than settlers in other districts. By examining the raw data, one can also single out which particular settlements have the worst records for violations. In the West Bank, 12 settlements have each been responsible for five or more incidents, with Yizhar settlement in Nablus District having by far the worst record, with 14 incidents over the year; see map. The settlers of Ma'on (in Hebron district) were responsible for eight incidents. Shvut Rachel (Nablus), Talmon (Ramallah) and Efrat (Bethlehem) settlements were each responsible for seven incidents.
Conclusion
The results of this first comprehensive survey manage to highlight a number of important issues despite the difficulties in gathering information encountered during the Intifada. The rapid increase in incidents since the beginning of the Intifada has been notable in both the West Bank and Gaza Strip. The West Bank saw a slight drop in the incident rate in December only to see the rate increase again in January. The Gaza Strip has faced a steady and steep increase in violations since October.
In addition to temporal changes, the data points out other permanent issues. Settlers in Hebron and the Gaza Strip were found to be the most active violators relative to their population sizes, though Yizhar settlement in Nablus District was found to have been responsible for the largest number of settler violations. Certain villages have been singled out as having been affected by particularly large numbers of violations. Al Khader village in Bethlehem District and Yatta village in Hebron suffered the most from violations.
Analysis of Satellite Images
To evaluate the expansions in settlements and bypass roads the satellite images of August 1999 and October 2000 were compared. The analysis of those images showed the following:
There were 50 locations at which expansions were noted. Some expansions, however, were outposts that were erected before 1999 but were not counted in the Base report since their status was still not confirmed. They were included in this report after Barak's government approved their status; click to see related topic1, topic2.
West Bank
The total area of settlement expansions in the West Bank was 2709 dunums.
The districts of Bethlehem and Qalqiliya have had the largest share of settlement expansions by area with 32% and 21% respectively; click here for map1, map2 of the locations of expansions.

From fieldwork and newspaper reports, the greatest number of expansion incidents occurred in Nablus District. However, expansions detected by satellite are somewhat different from the incidents collected through fieldwork and newspaper reports. One incident recorded on the ground could represent bulldozing a small area of land or moving a fence to extend a settlement. Whereas the satellite images only show the large changes that have occurred between the dates of the two images. This difference in scale and detail measured explains the apparent disagreements between the results obtained by the two methods. There may have been more individual incidents in Nablus but many incidents may have occurred at one expansion site and so will be counted as one expansion on the satellite image. Alternatively, Nablus may have experienced many small expansions that do not show up on the satellite image.
The data from the satellite image is more informative than that from fieldwork as it provides accurate expansion areas. However the data from fieldwork is essential as it helps to guide the analysis of the satellite image. The following table details the expansions detected from the satellite images for August 1999 and October 2000.
|
DISTRICT |
|
MOTHER SETTLEMENT |
EXPANSION |
AREA in dunums (1 dunum = 1000m2) |
|
Bethlehem |
1 |
Har Gilo |
New Expansion |
332 |
|
|
2 |
Neve Daniyyel |
New Expansion |
263 |
|
|
3 |
Kefar David |
Outpost_Sdeh Bar Farm |
125 |
|
|
4 |
Tekoa |
New Expansion |
122 |
|
|
5 |
Betar Illit |
New Expansion |
28 |
|
|
6 |
Alon Shevut |
Outpost_Givat Ha�¢??hish |
19 |
|
|
7 |
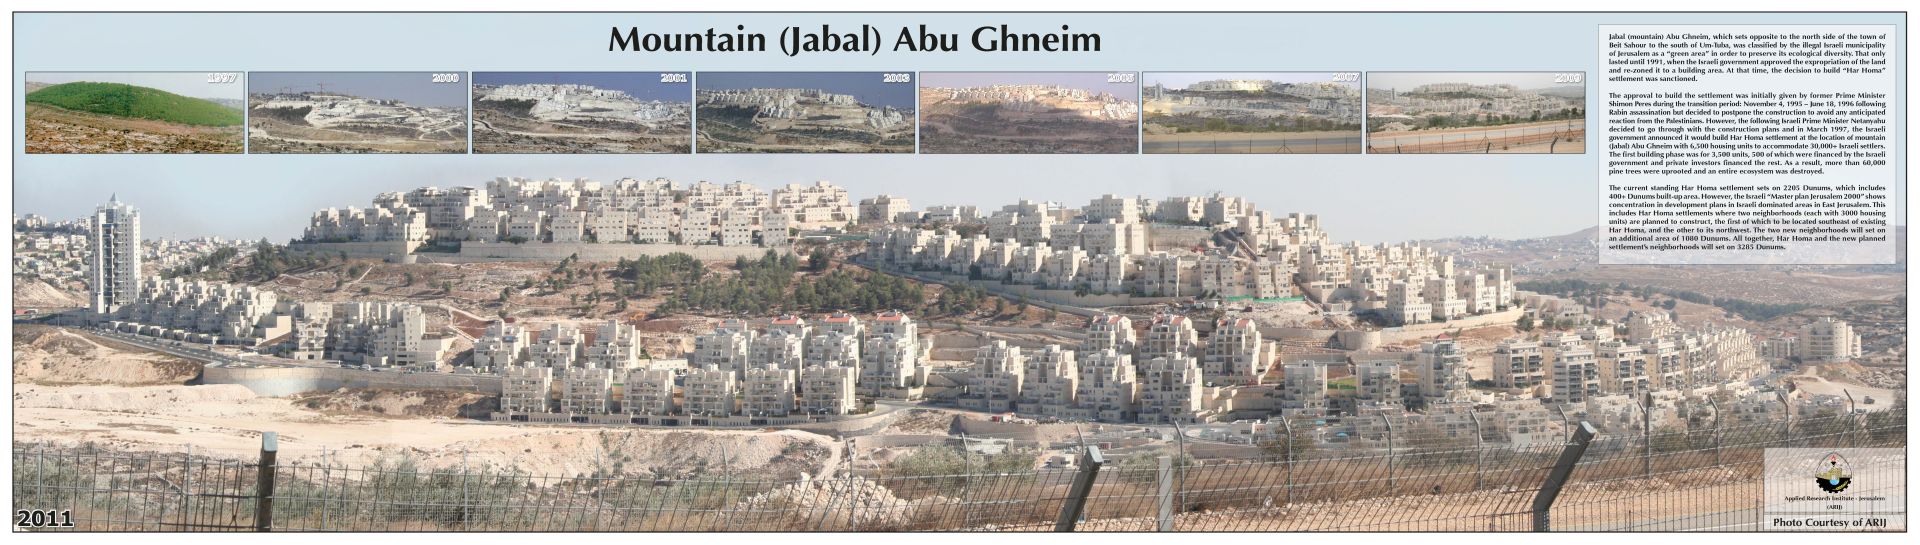
Har Homa |
New Expansion |
18 |
|
Total |
|
|
|
907 |
|
|
|
|
|
|
|
Hebron |
1 |
Migdal Oz |
New Expansion |
104 |
|
|
2 |
Ma'ale Amos |
Outpost_Ivei Ha'nachal |
87 |
|
|
3 |
Maon |
New Expansion |
33 |
|
|
4 |
Metzadot Yehuda |
Outpost_Nof Nesher |
31 |
|
|
5 |
Tene Omarim |
Outpost_Tene Omarim SE Caravans |
26 |
|
|
6 |
Suseya |
Outpost_Magen David Farm |
10 |
|
|
7 |
Tene Omarim |
Outpost_Tene Omarim N Caravans |
4 |
|
|
8 |
Maon |
Outpost_Maon Farm |
2 |
|
Total |
|
|
|
297 |
|
|
|
|
|
|
|
Jericho |
1 |
near_Maale Efrayim |
New Site |
159 |
|
|
2 |
Pezael (Fezael) |
New Expansion |
22 |
|
Total |
|
|
|
181 |
|
|
|
|
|
|
|
Jerusalem |
1 |
Pisgat Amir |
New Expansion |
77 |
|
|
2 |
Adam (Geva Benyamin) |
New Expansion |
62 |
|
|
3 |
2091950_near Ramot |
New Expansion |
38 |
|
|
4 |
Kokhav Yaacov |
New Expansion |
29 |
|
Total |
|
|
|
206 |
|
|
|
|
|
|
|
Nablus |
1 |
Homesh |
New Expansion |
32 |
|
|
2 |
Bracha |
Outpost Beracha A |
16 |
|
|
3 |
2030350_Gvaot Olamn |
New Expansion Gvaot Olamn |
12 |
|
|
4 |
Mizpe Rahel ( Shvut Rahel ) |
Outpost Ahiya (Hill D) |
9 |
|
|
5 |
Shilo |
New Expansion |
8 |
|
|
6 |
Itamar |
Outpost Hil Neighborhood (Hill 777) |
8 |
|
|
7 |
Yitzhar |
Outpost Yitzhar Eastern Hill |
7 |
|
|
8 |
Yitzhar |
Outpost Ahuzat Shalhevet |
4 |
|
|
9 |
Bracha |
Outpost Sneh Ya'akov |
1 |
|
Total |
|
|
|
97 |
|
|
|
|
|
|
|
Qalqiliya |
1 |
near Alfe Manashe |
New Site |
219 |
|
|
2 |
near Zufin |
New Site |
185 |
|
|
3 |
Neve Oranim |
New Expansion |
142 |
|
|
4 |
2050760 – near Alfe Manashe |
New Expansion |
9 |
|
|
5 |
Karne Shomron |
Outpost_Nof Kane Farm |
7 |
|
Total |
|
|
|
562 |
|
|
|
|
|
|
|
Ramallah |
1 |
2081360 next to Shilo |
New Expansion |
156 |
|
|
2 |
Shilo |
Outpost Shillo East 2 |
48 |
|
|
3 |
Kochav Ha'shachar |
Outpost Mizpe Keramim |
35 |
|
|
4 |
Ofra |
Outpost Amona |
26 |
|
|
5 |
Shilo |
Outpost Givat Harel (Hill 740) |
17 |
|
|
6 |
Menora |
New Expanstion |
15 |
|
|
7 |
Shilo |
Outpost Shillo East 1 |
10 |
|
|
8 |
Halamish |
Outpost Zofit Farm |
7 |
|
|
9 |
Talmon North |
Outpost Haresha |
4 |
|
|
10 |
Shevut Rachel |
Outpost Adi Ad (Hill F, Hill 799) |
1 |
|
Total |
|
|
|
319 |
|
|
|
|
|
|
|
Salfit |
1 |
Ginnot Shomeron |
New Expansion |
53 |
|
|
2 |
Yakir |
New Expansion |
39 |
|
|
3 |
Kefar Tapuah |
Outpost Kefar Tapuah Hill 660 |
35 |
|
|
4 |
Between Gavri'el , Barqan |
New Site |
7 |
|
Total |
|
|
|
134 |
|
|
|
|
|
|
|
Tulkarm |
1 |
Avnei Hefetz |
Outpost Avnei Hefetz Eastern Caravans |
6 |
|
Total |
|
|
|
6 |
|
|
|
|
|
|
|
TOTAL |
2709 |
|
||
The results obtained for the changes in the by pass roads between August 1999 and October 2000 are shown below.
|
Bypass Road |
District |
Length in kilometers |
|||
|
1 |
West of Negohot |
Hebron |
1.9 |
||
|
2 |
West of Adora |
Hebron |
4.7 |
||
|
3 |
Close to Shima |
Hebron |
3.2 |
||
|
4 |
South of Dolev |
Ramallah |
2.2 |
||
|
5 |
South of Shilo |
Nablus |
2.3 |
||
|
6 |
Between Barqan and Alei Zahav |
Nablus |
8.0 |
||
|
7 |
North of Maale Amos |
Hebron |
1.7 |
||
|
TOTAL |
|
24.1 |
|||
The district which has suffered most from bypass building work is Hebron click for map1, map2. Four new roads showed up on the satellite image, with a total length of 12 km. Some of these roads are still being built, others are already finished. When the 75m buffer zone on either side of a by pass road is taken into account, the total width of a bypass is 0.165km. Thus the total area that is affected by by-pass roads built between the two satellite images is 4 km2 or 4,000 dunums.


The total area of the West Bank affected by those settlement expansions and new roads that show up on the satellite images is nearly 7,000 dunums.
Gaza Strip
Methods of data collection were more limited in the Gaza Strip than the West Bank due to differences in the quality of the satellite images. More accurate data has become available for the base report and this has now been updated, the updated details for the Gaza settlements are now being used in the maps; click for details). However, the quality of the October 2000 satellite images in the Gaza Strip has made it impossible to accurately determine the area of settlement expansion between these two dates. Therefore, instead of marking the sites were expansion was identified from the satellite images, the map for expansion in the Gaza Strip marks only the sites mentioned in newspaper reports and from fieldworkers, i.e. the information collected in the monthly reports between February 2000 and January 2001; click for map.
Updated base report from August 1999
|
Gaza |
|
|
|
|
|
|
Number |
Name |
Area in km2 |
District |
|
|
2800 |
Erez |
0.5999 |
Jabalya |
|
|
2810 |
Nisanit (New Site) |
0.4875 |
Jabalya |
|
* |
2820 |
Nisanit |
0.1385 |
Jabalya |
|
* |
2830 |
Ele Sinai |
0.2694 |
Jabalya |
|
* |
2840 |
Dugit |
0.2099 |
Jabalya |
|
* |
2850 |
Netzarim |
0.3065 |
Gaza |
|
|
2860 |
Netzarim B |
0.0938 |
Gaza |
|
* |
2870 |
Kfar Darom |
0.0789 |
Deir al Balah |
|
* |
2880 |
Netzar Hazzani |
1.9206 |
Khan Yunis |
|
* |
2900 |
Katif |
0.4829 |
Khan Yunis |
|
* |
2910 |
Gannei Tal |
1.2735 |
Khan Yunis |
|
|
2920 |
|
0.0806 |
Khan Yunis |
|
|
2930 |
Gaza Beaches |
0.1242 |
Khan Yunis |
|
* |
2950 |
Neve Dekalim |
1.0975 |
Khan Yunis |
|
|
2960 |
Kefar Yam |
0.0764 |
Khan Yunis |
|
* |
2970 |
Gadid |
1.0702 |
Khan Yunis |
|
|
2980 |
|
0.9196 |
Khan Yunis |
|
* |
2990 |
Gan Or |
0.3879 |
Khan Yunis |
|
* |
3000 |
Morag |
0.4303 |
Rafah |
|
* |
3010 |
Bedolah |
1.2849 |
Khan Yunis |
|
* |
3020 |
Mizp `Azmona |
0.3818 |
Rafah |
|
|
3030 |
Peat Sadeh (New Site) |
0.3652 |
Rafah |
|
* |
3040 |
Peat Sadeh |
0.4192 |
Rafah |
|
* |
3050 |
Rafih Yam |
0.1525 |
Rafah |
|
Sub total area |
|
12.6515 |
|
|
Prepared by:
The Applied Research Institute – Jerusalem


