Israeli settlements in the West Bank and Gaza strip are a major obstacle to the resolution of the Palestinian-Israeli conflict. Yet all Israeli governments have contributed to the building and expansion of Jewish colonies. The Etzion block of colonies is made up of 14 communities. In this case study 11 have been selected for focus because of their physical arrangement. These are Allon Shevut, Efrat, El Azar, Gevaot, Kefar Ezion, Neve Daniyal, Rosh Zuirm, Bet Iyen, Hadar Betar, Betar Illit and Migdal 'Oz. This large cluster of colonies houses over 20,000 Israeli colonists and is threatening to expand further. Such an expansion restricts Palestinian land development and access to their own natural resources.
Attempts to colonise the region of the Etzion block began early with the construction of Kefar Etzion directly after the 1967 War. Colonization activity in this area has continued throughout the occupation due to the abundant water resources in the region and its location between one of the major Palestinian Cities (Bethlehem) and the 1949 Armistice line (The Green Line). For example, Betar Illit and Hadar Betar seem to be located with a clear guiding strategy. These two colonies are expanding in the direction of Mevo Betar, which lies on the other side of the 1949 Armistice Line. This would seem to make it easier for the Israelis to claim the colonies as contiguous and as lying within Israel. Israelis consider the Etzion Block to be part of greater Jerusalem despite its location south of Bethlehem. Most of the Etzion block is built on land originally belonging to the Palestinian villages of Al-Khader, Hussan and Nahhalin.
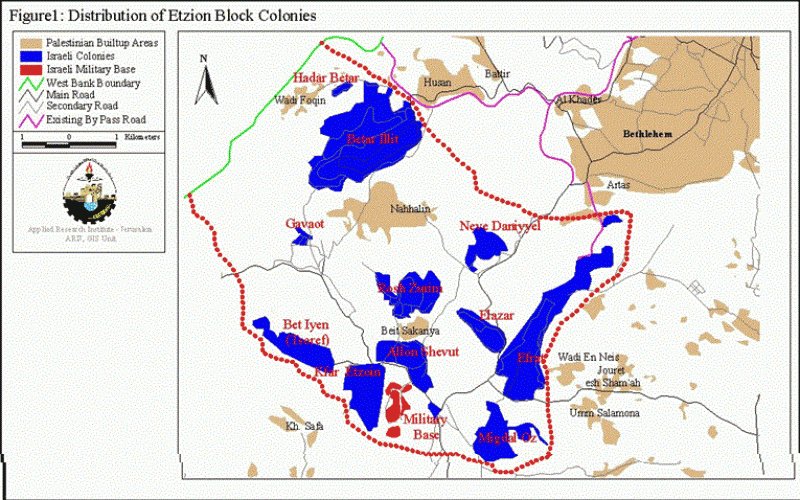
Figure 1: Distribution of Etzion block settlements.
The expansion of the Israeli colonies in this area has lead to a substantial block of colonies to the south of Bethlehem. This block creates facts on the ground that Israel is now using to lend support to carving this area from the West Bank and annexing it to Israel. The existence of these colonies, with the possibility of the land being annexed to Israel, diminishes the area available for the sustainable development of Bethlehem. These colonies hinder the urban expansion of Bethlehem and cut off agricultural and grazing areas which Palestinian farmers depend on as a major source of income. Figure 1 shows how this block and the land within it could be annexed to Israel proper. The expansion of the Etzion block could prevent any contiguity between Bethlehem, Hebron, and many Palestinian communities in the southern part of the West Bank. The current period of closure by the Israeli army, preventing movement between areas A, B and C, has demonstrated the ability of the Israelis to disrupt Palestinian society and economy at any time. It is essential for the viability of a Palestinian state that any annexing of settlement blocks does not hinder the ease of movement of Palestinians. Otherwise the society would be left open to further severe damage as caused by Israel during the current Al-Aqsa Intifada.
Figure 2: The Expansion areas in Etzion block.
Table 1: The Calculation of Expansion Area
|
Settlement Name |
Year Founded |
Area in 1993 |
Area in 2000 |
Expanded Area |
% change |
|
Hadar Betar |
1978 |
3 |
5 |
2 |
67% |
|
Kfar Etzion |
1967 |
32 |
60 |
28 |
88% |
|
Elazar |
1975 |
20 |
42 |
22 |
110% |
|
Efrat |
1979 |
80 |
170 |
90 |
113% |
|
Allon Shevut |
1971 |
24 |
61 |
37 |
154% |
|
Neve Daniel |
1982 |
17 |
46 |
29 |
171% |
|
Betar Illit |
1989 |
81 |
320 |
239 |
295% |
|
Rosh Zurim |
1969 |
11 |
62 |
51 |
464% |
|
Migdal Oz |
1977 |
19 |
114 |
95 |
500% |
|
Bet Iyen (Tsoref) |
1989 |
5 |
39 |
34 |
680% |
|
Gavaot |
2 |
9 |
7 |
350% |
|
|
Military Base |
6 |
30 |
24 |
400% |
|
|
Areas are in Hectares Source: ARIJ, GIS Unit |
|||||
Table 2: Population growth
|
Settlement Name |
Population End of 1996 |
Population End of 1997 |
Population End of 1998 |
Average Annual population growth 96-98 |
|
Hadar Betar |
NA |
NA |
NA |
|
|
Kfar Etzoin |
418 |
400 |
415 |
-0.28% |
|
Elazar |
397 |
503 |
663 |
29.25% |
|
Efrat |
5,630 |
5,930 |
6,120 |
4.27% |
|
Allon Shevut |
1,910 |
1,930 |
1,980 |
1.82% |
|
Neve Daniel |
603 |
691 |
780 |
13.74% |
|
Betar Illit |
7,570 |
9,760 |
11,300 |
22.35% |
|
Rosh Zurim |
251 |
292 |
299 |
9.37% |
|
Migdal Oz |
266 |
281 |
290 |
4.42% |
|
Bet Iyen (Tsoref) |
430 |
459 |
500 |
7.84% |
|
Gavaot |
NA |
NA |
NA |
|
|
Military Base |
NA |
NA |
NA |
|
|
Total |
17,475 |
20,246 |
22,347 |
13.1% |
Sources: Statistical Abstracts of Israel, Peace Now Settlement Watch Report January2000
-
Table 1 indicates the dramatic expansion of the area of the Eztion block group of settlements since the Oslo agreement. Apart from Hadar Betar and Kfar Etzion, all the settlements have expanded by more than 100%.
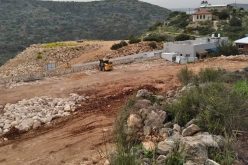
-
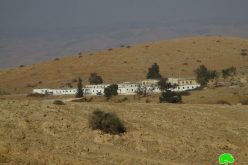
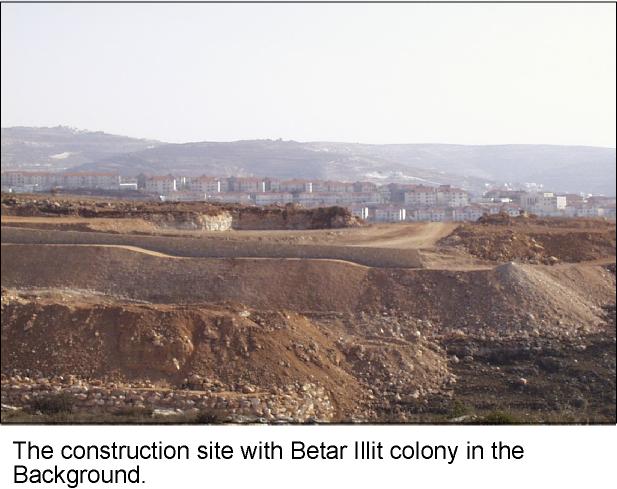
The most significant expansion has been that of Betar Illit, which has expanded by 239 hectares; see photo.
-
Table 2 shows that the population growth rate in these settlements far exceeds the population growth of the Israeli population (which averaged at 2.5% per year for these three years). In addition, one can see that the expansion rate of the settlements is much larger than the rate at which their populations are growing. This suggests that the urban expansion witnessed is the result of more broad territorial aims rather than just being to accommodate a growing population.
The ongoing expansion of Etzion block hinders the ability of Palestinians to access their natural resources. By constraining the future development of Bethlehem, this group of settlements threatens the possibility of a stable peace. As these settlements expand, it becomes more likely that Israel will expect to annex this piece of land taking yet more land from Palestinian villagers and farmers in the process.
Prepared by:
The Applied Research Institute – Jerusalem